Observability for the engineers who keep the internet running.
THE PROBLEM
Kentik’s existing Kubernetes product saw little use. I investigated why through analytics, customer interviews, and surveys. Those findings led leadership to commission a new experience, which I led through discovery and design.
WHAT I LED
Principal Product Designer
Led product design and UX research.
Facilitated design-thinking workshops with customers and stakeholders.
Shaped the product roadmap and network-mapping experience.
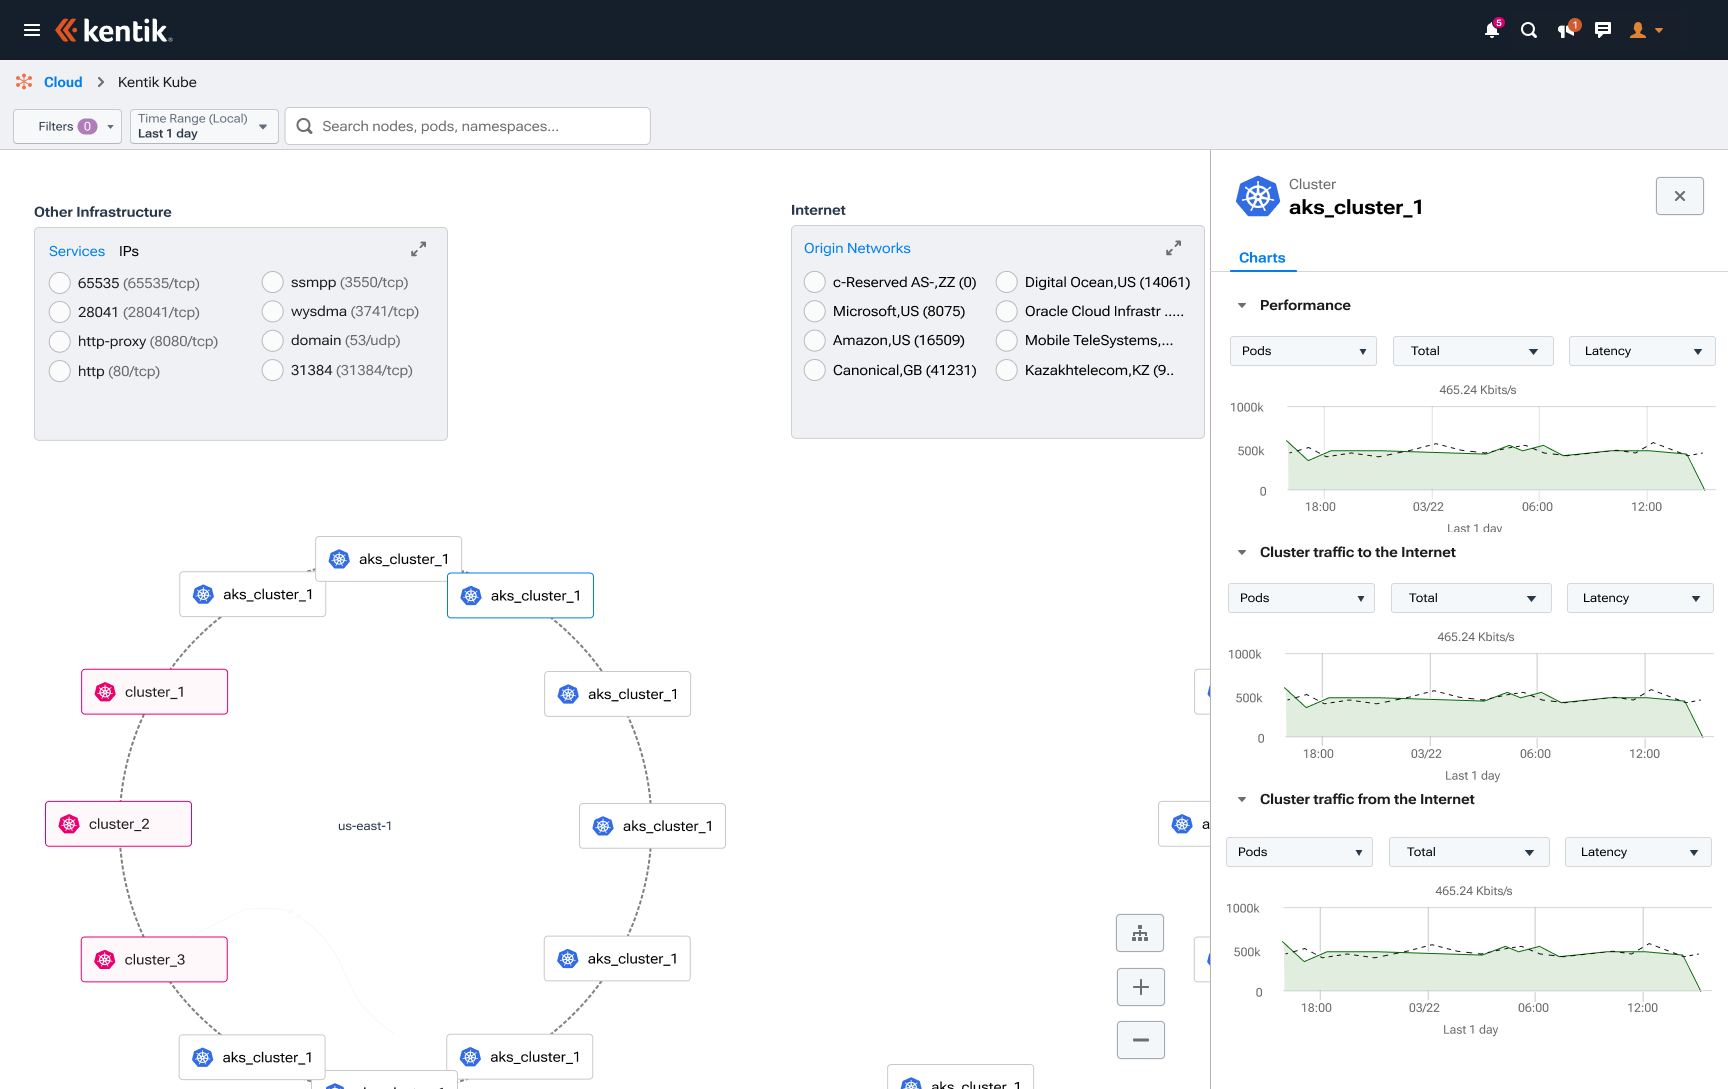
The shipped experience. A topology canvas replaces table-heavy exploration; the adjacent drawer keeps performance and traffic detail beside the selected cluster.
SELECTED DESIGNS · SHIPPED PRODUCT
A closer look at the experience.
Final designs shipped across MVP and subsequent releases. Pod views were added after MVP.
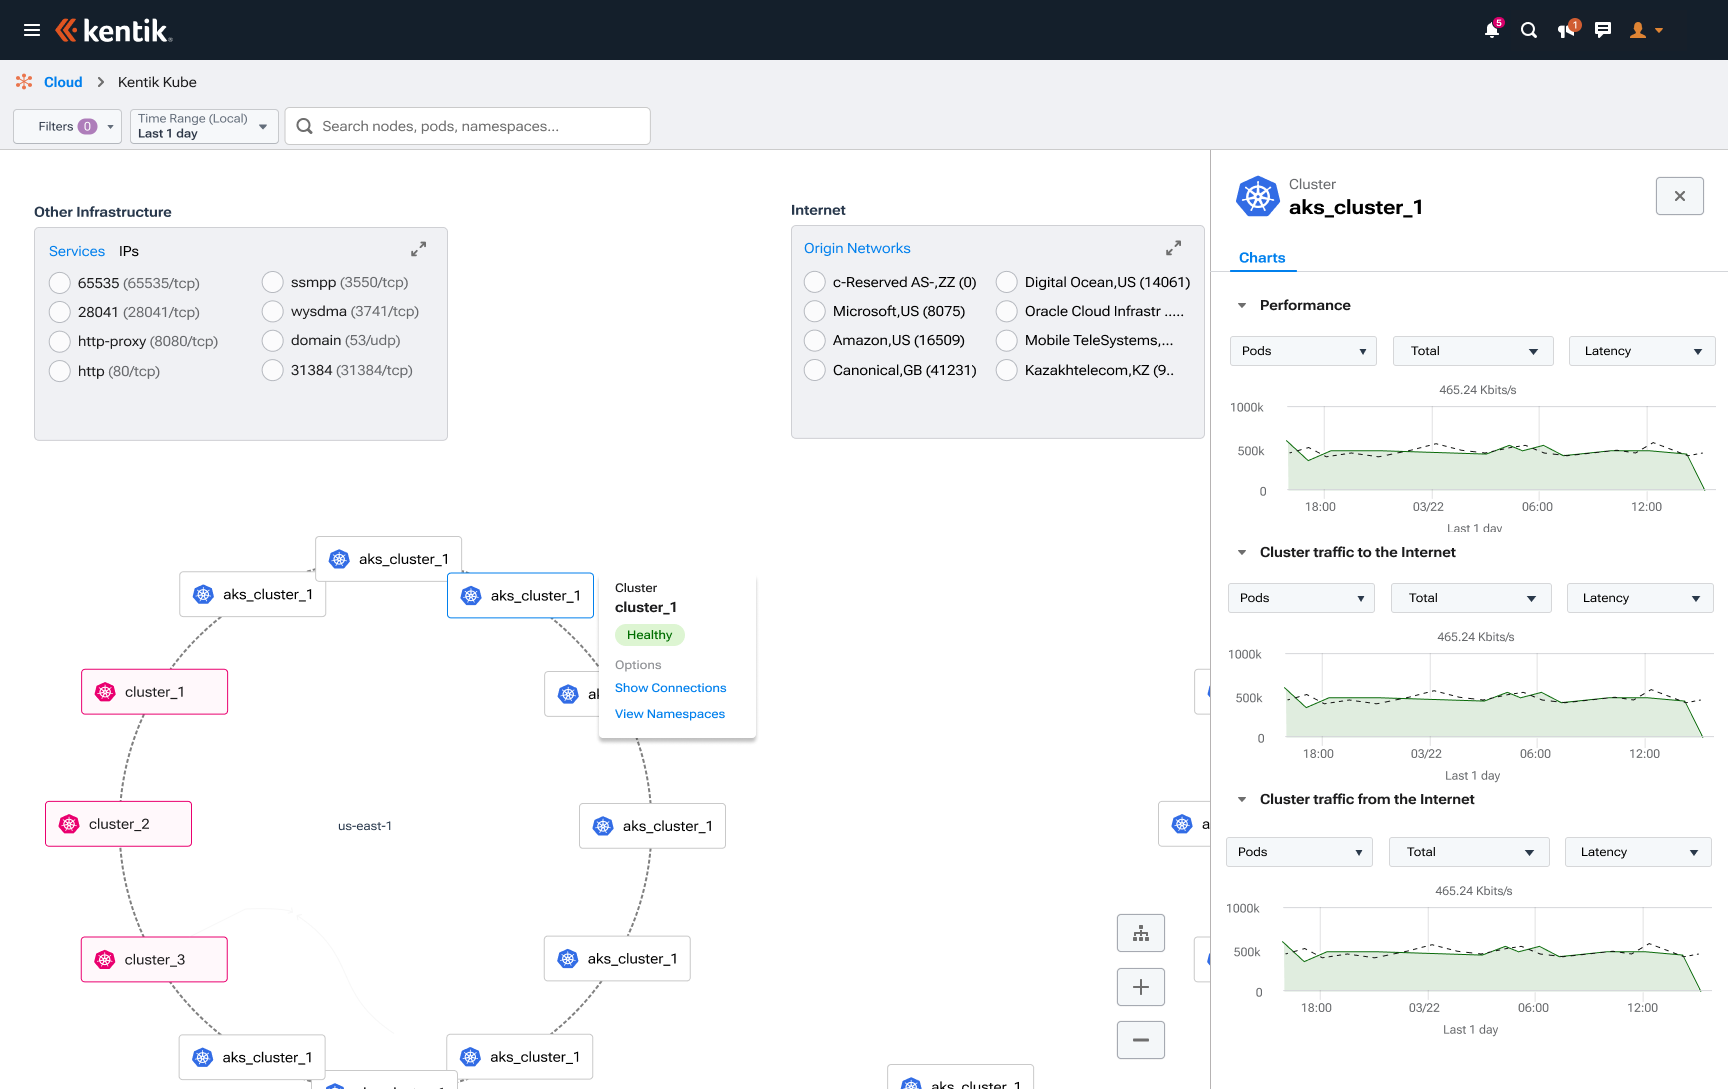
Contextual cluster actions offer two clear paths: reveal connections or explore namespaces.
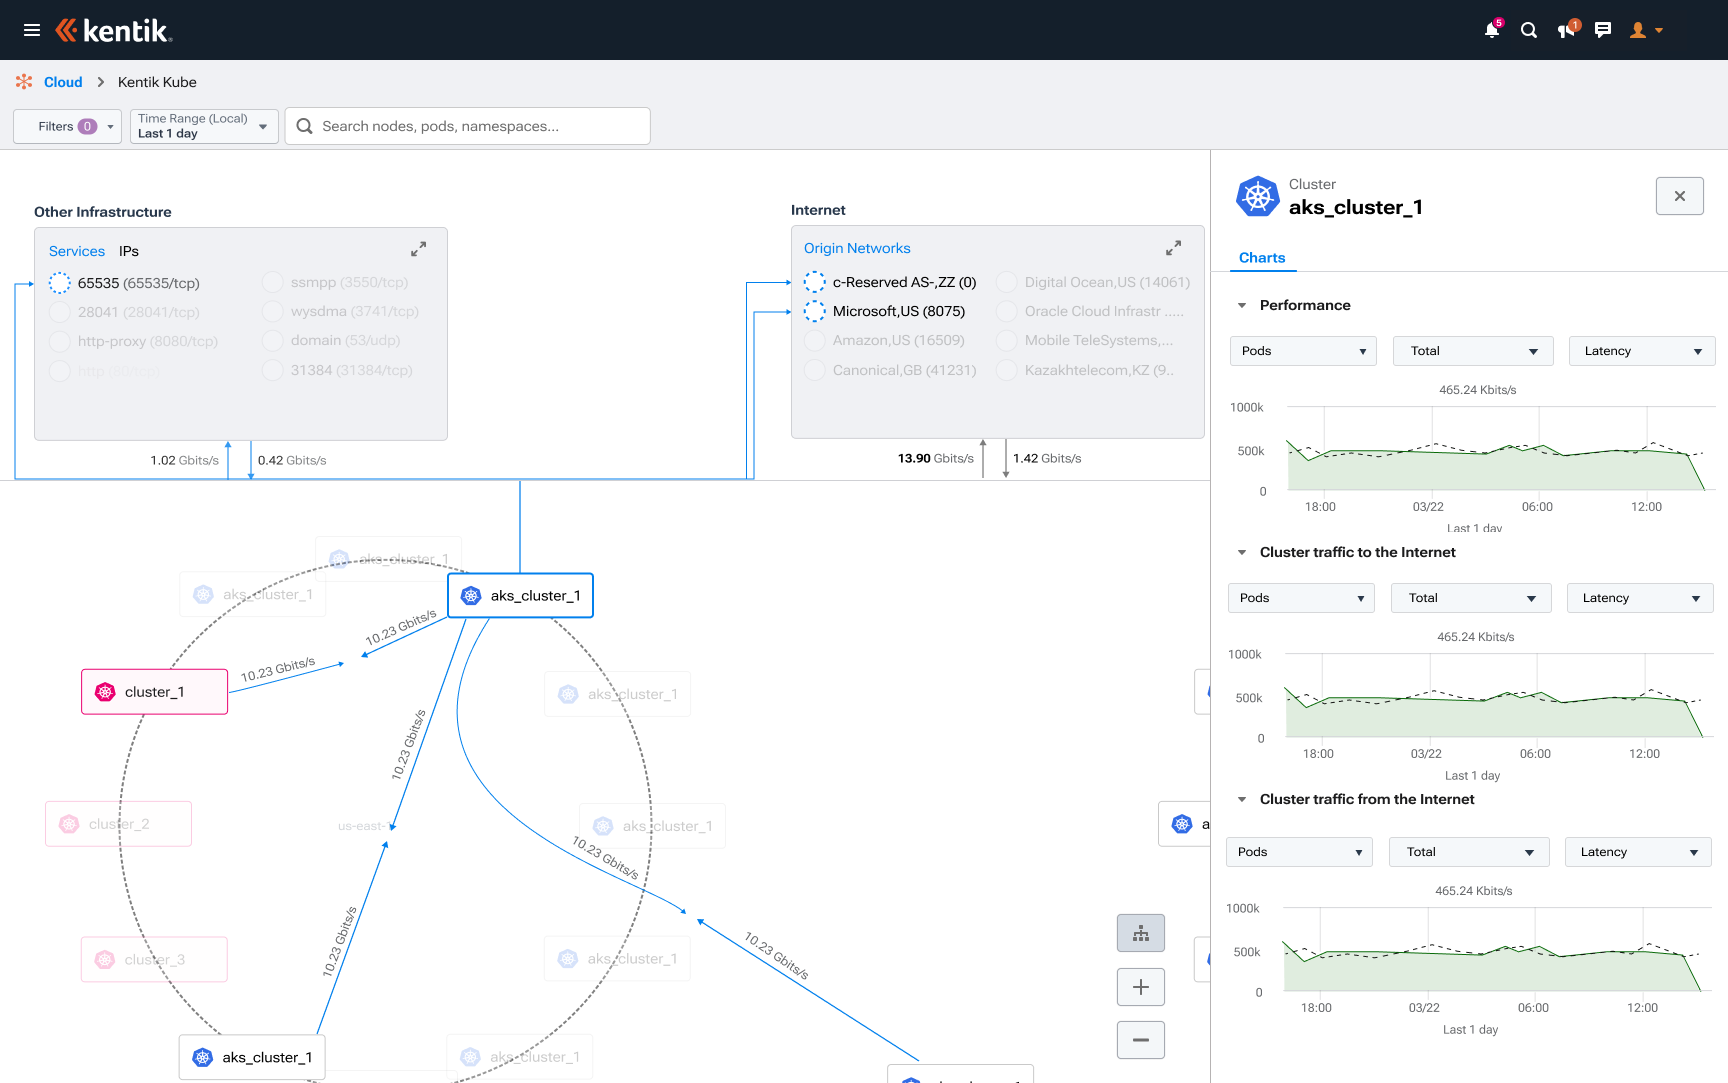
Showing traffic volumes on connections helps users investigate relationships between clusters and the internet.
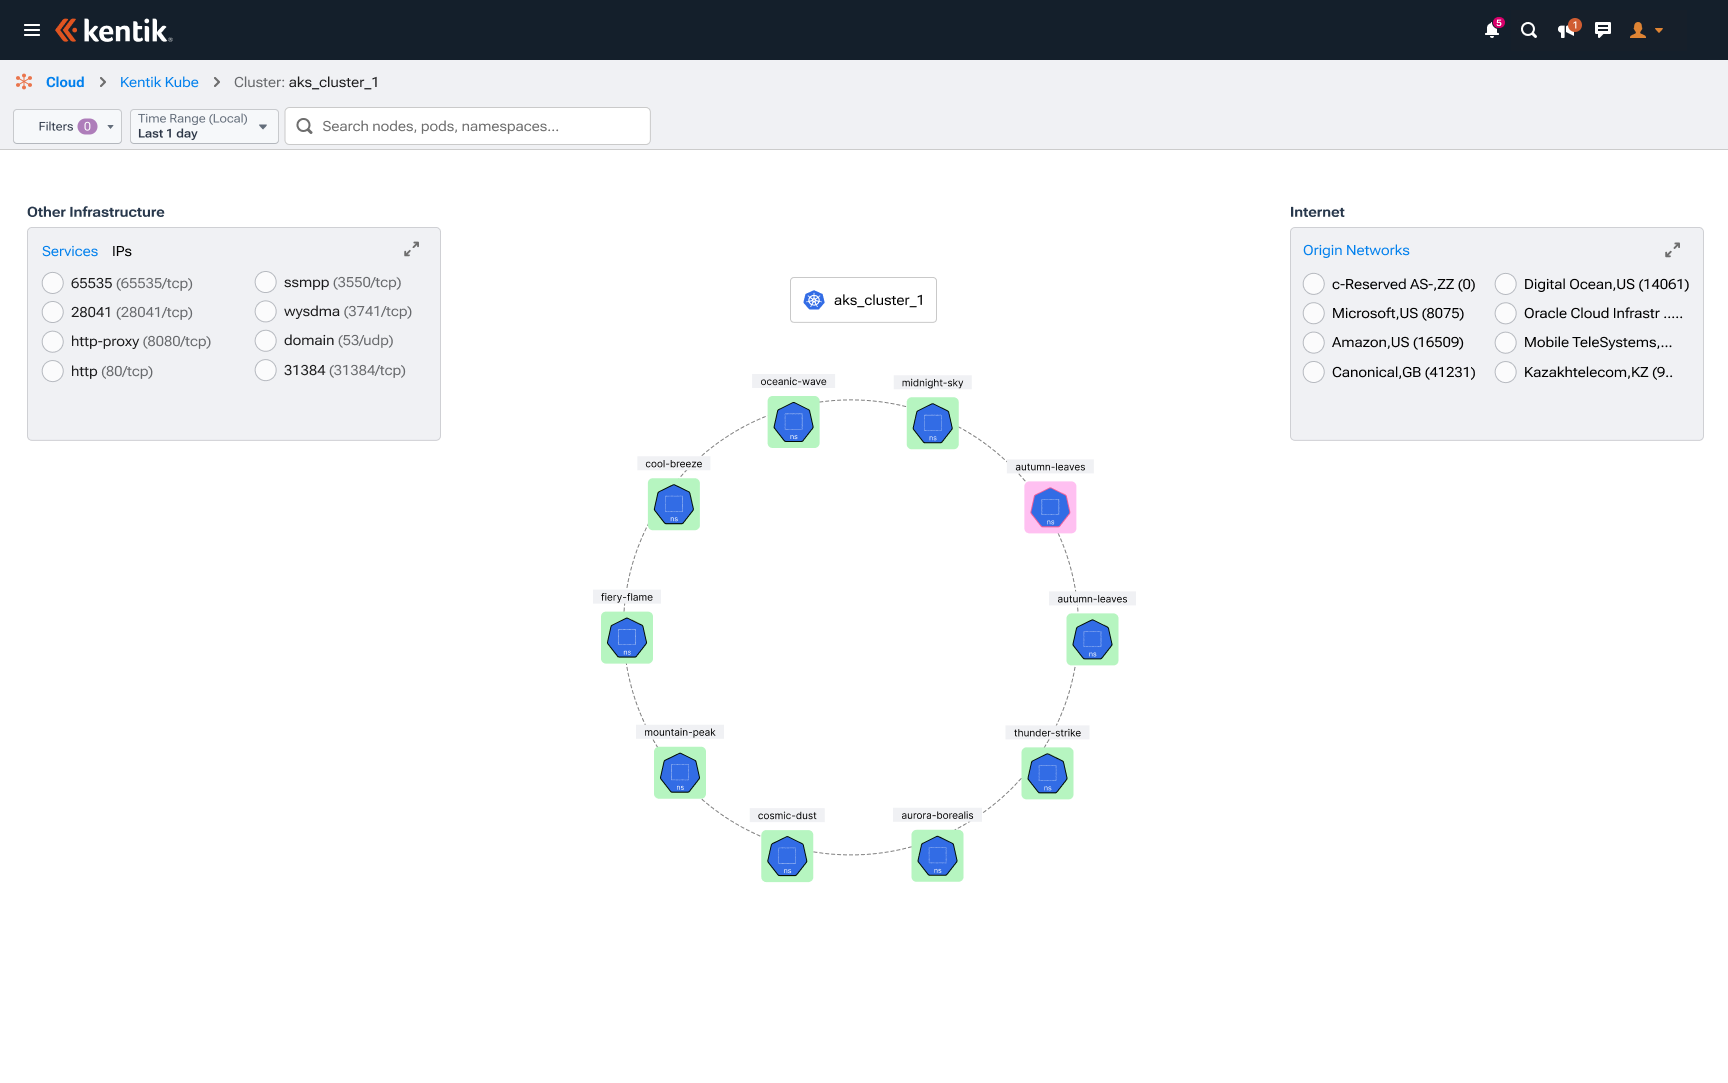
Namespaces appear around the selected cluster, preserving their relationship to the parent as users explore.
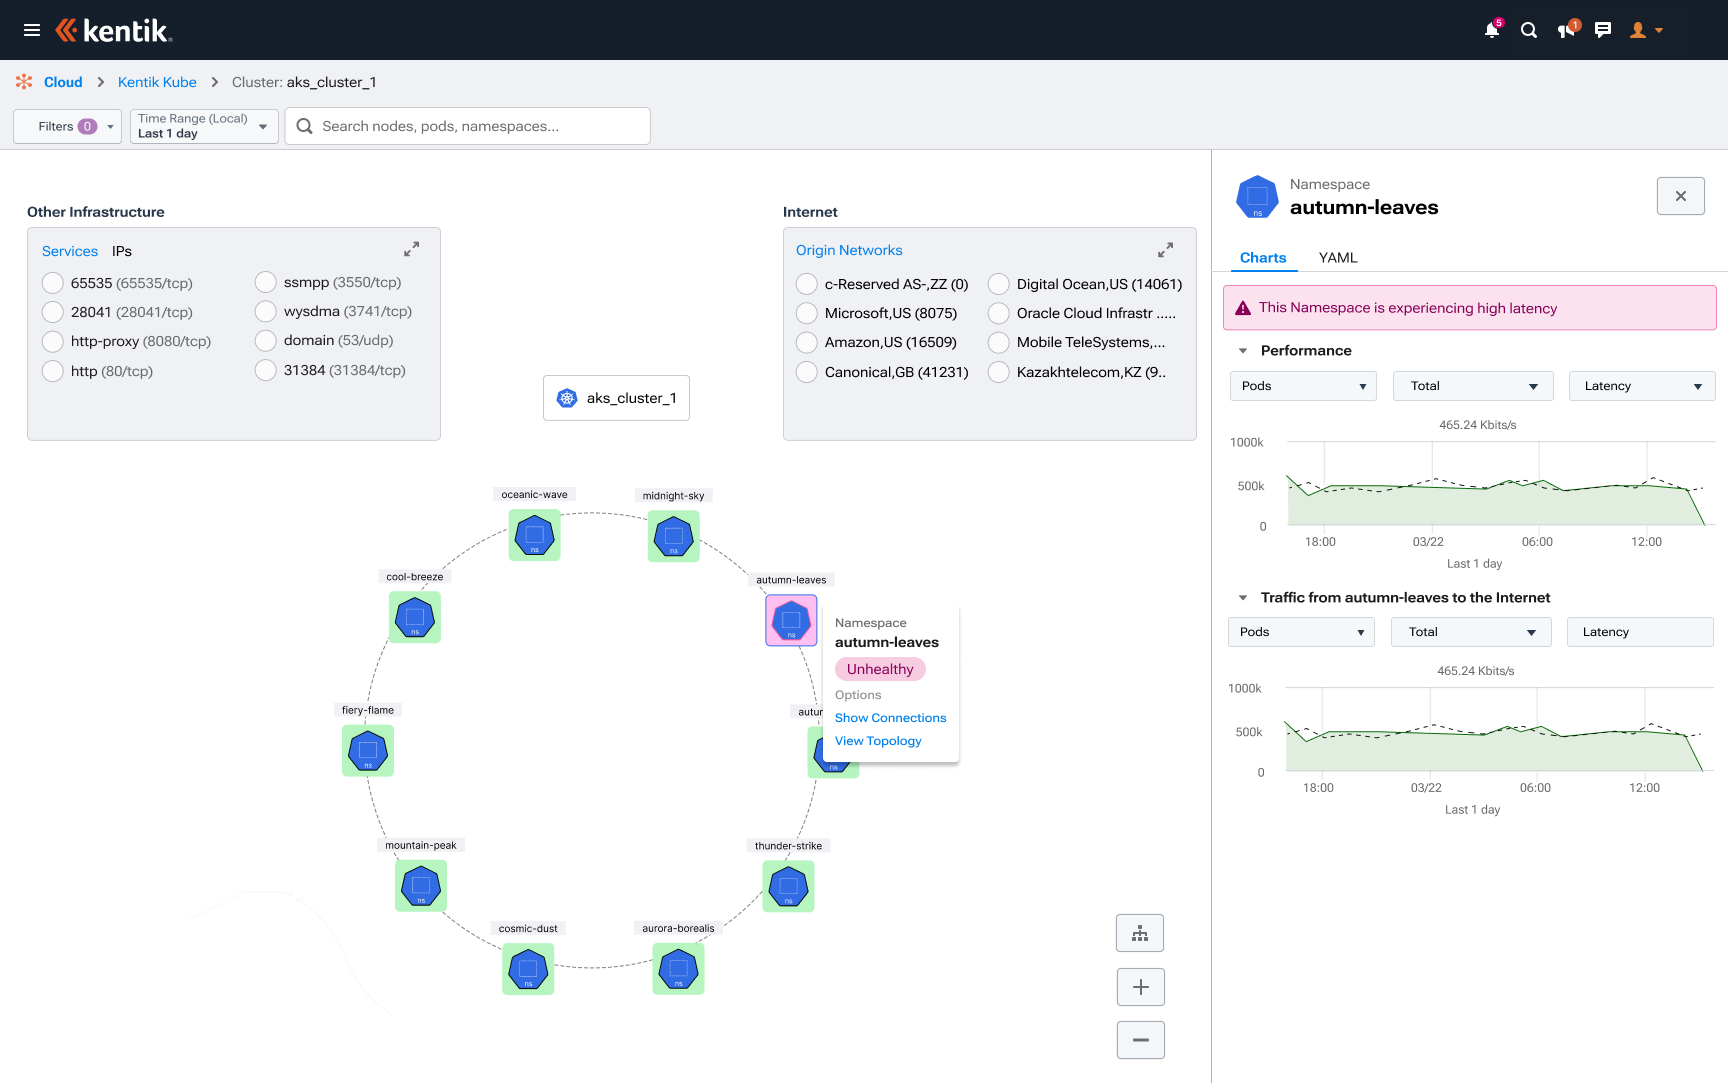
An unhealthy namespace is flagged on the canvas; supporting charts remain available in the drawer.
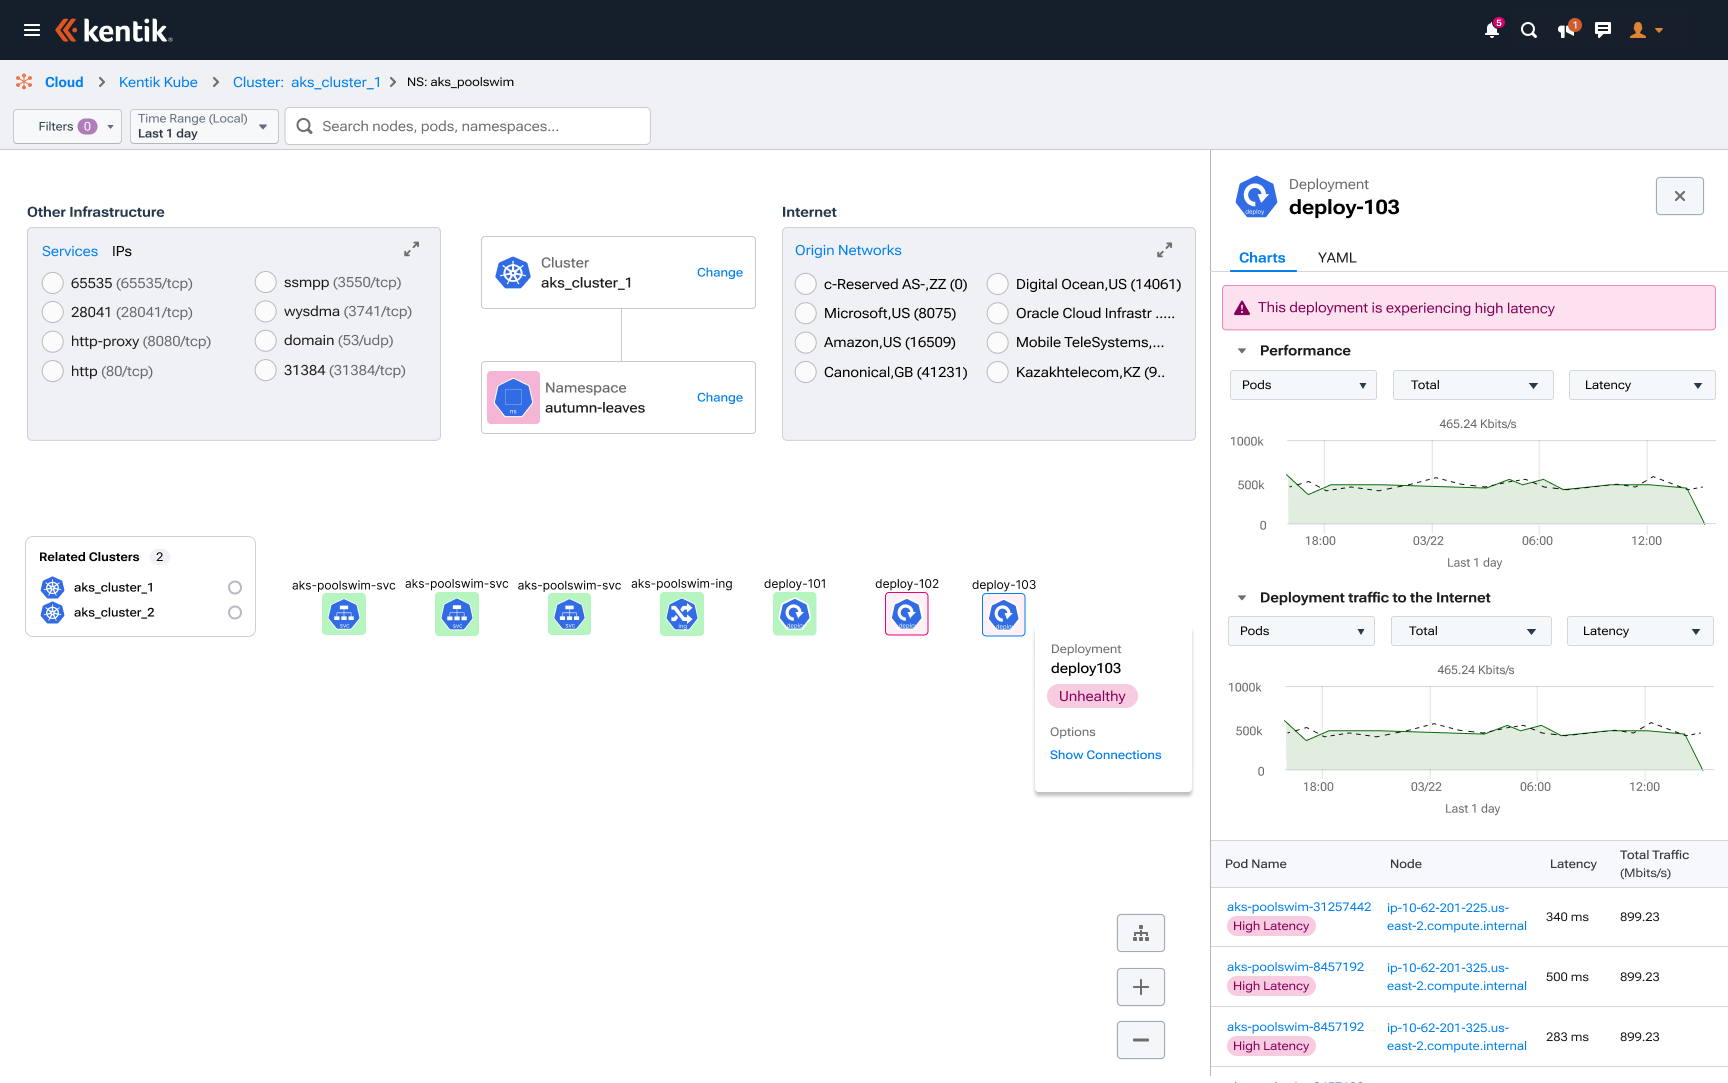
An unhealthy deployment flagged on the canvas, with latency charts and pod details alongside it to support investigation.
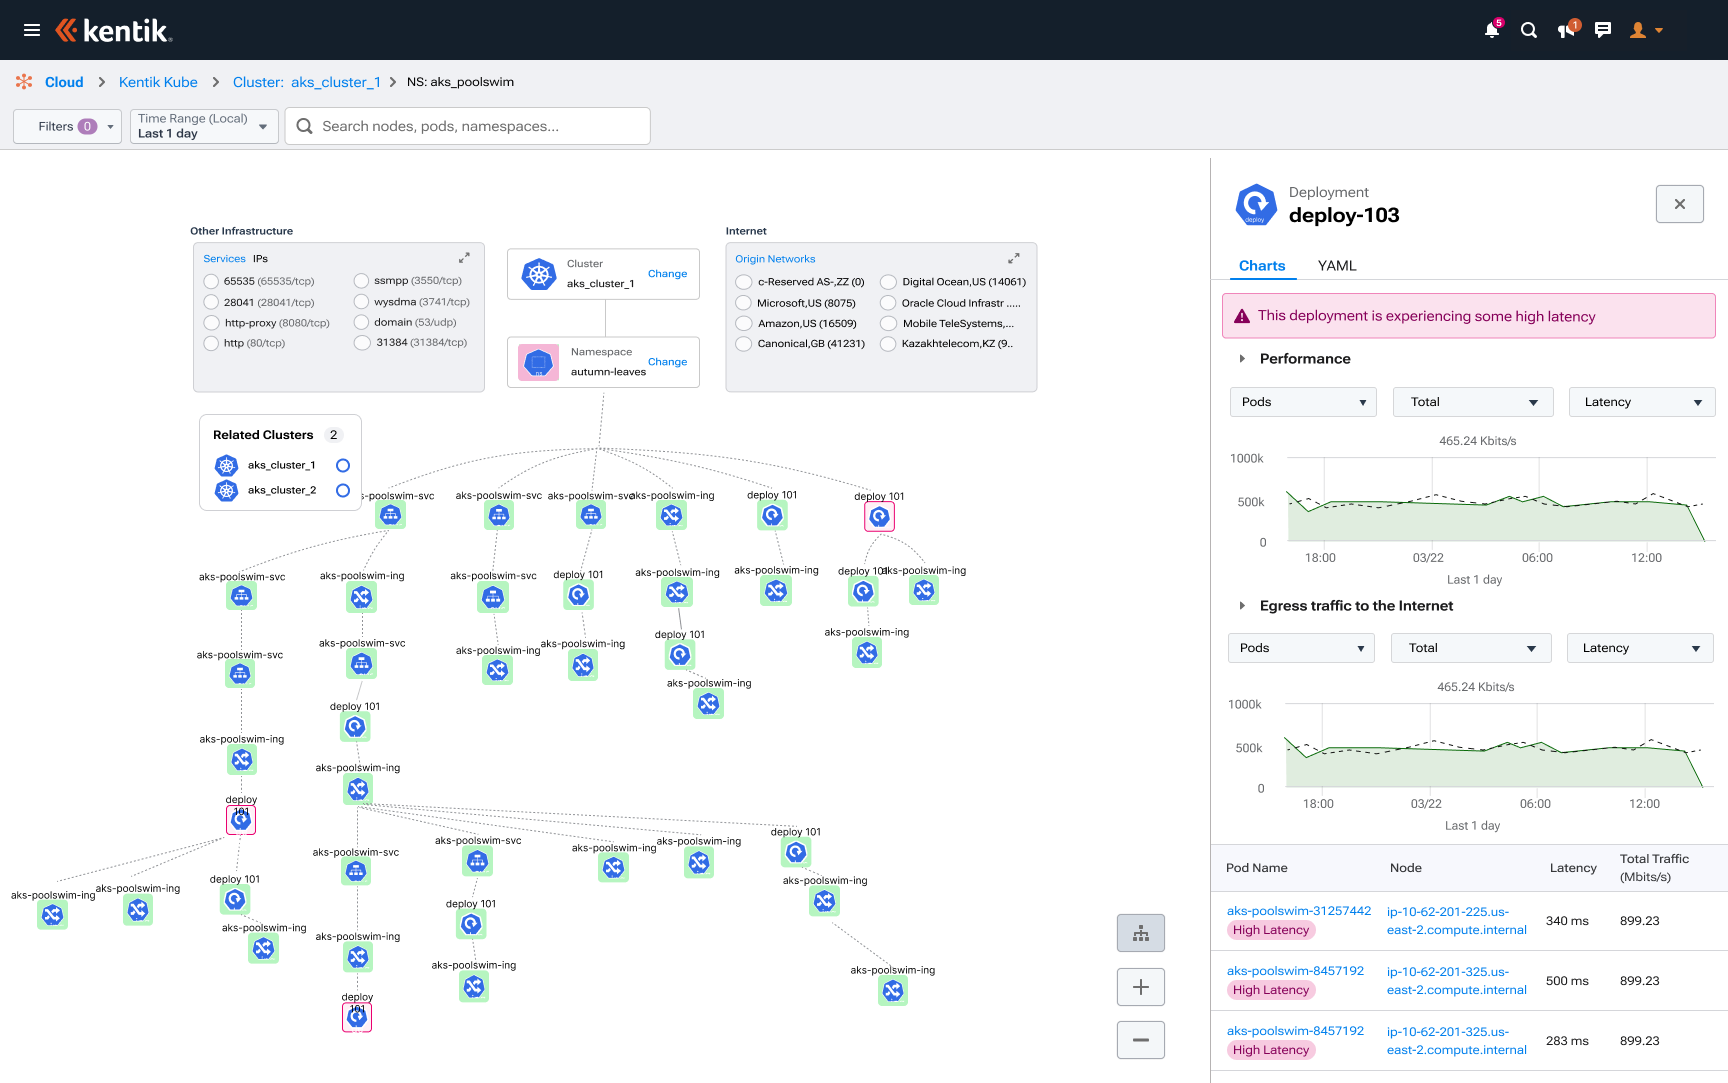
Expanded deployment topology showing connected resources while keeping performance and latency details in view.
1 / 6
THE IMPACT
Hours to minutes to locate network issues, reported by customer cloud engineers. The visual topology replaced searching through pages of tables and gave PMs and engineers shared context for taking action. Sales reported $10M+ in closed product sales following the KubeCon demos and launch. Customers embraced it because it addressed their core frustrations: navigating complex networks, locating issues, and sharing context with their teams.
Hours to minutesto locate issues, customer-reported
$10M+closed product sales, reported by sales
Adoption across teamsadditional engineers actively using the product, confirmed in Pendo
Connected networks in viewsurveys reported easier discovery of related networks in one visual topology
I can finally see it so easily and show my team the issues at every level.
Oil & Gas product managers / lead engineers
Want to see how we got there?
MY ROLE
Principal Product Designer
Led product design and UX research.
Facilitated design-thinking workshops with customers and stakeholders.
Shaped the product roadmap and network-mapping experience.
The shipped experience. A topology canvas replaces table-heavy exploration; the adjacent drawer keeps performance and traffic detail beside the selected cluster.
01 · About
About the project
Customers use Kentik to observe their cloud networks. My role focused on network-mapping architecture, making complex networks easier for cloud network architects to understand and navigate.
These environments can span Amazon Web Services (AWS), Microsoft Azure, Google Cloud Platform, and Kubernetes.
Team
CTO
VP
3 Engineers
Product Manager
External stakeholders across procurement, legal, finance & vendor risk
Tools
Miro
Figma
Axure
Pendo
Fullstory
02 · The Problem
The problem
Kentik’s existing Kubernetes product saw little use. I reviewed analytics, interviewed customers, and conducted surveys to understand why. The findings led leadership to pursue a new product experience and ask me to lead discovery and design.
03 · Discovery
Discovery & research
I spoke directly with customer cloud network engineers and facilitated the workshops myself to understand how they investigated issues, navigated Kubernetes, and shared findings with colleagues. I used those customer insights to influence the design direction with my VP, CTO, and team, which included engineering and product management.
A few surprising discoveries
Enterprise cloud-network engineers often needed help with cloud network architecture, especially Kubernetes.
Customers wanted an easy way to navigate their network the moment something went wrong on their Kube cluster.
A table view didn’t work: too much information to search, and processing it was frustrating.
It was especially hard to communicate network problems when collaborating with colleagues around the world.
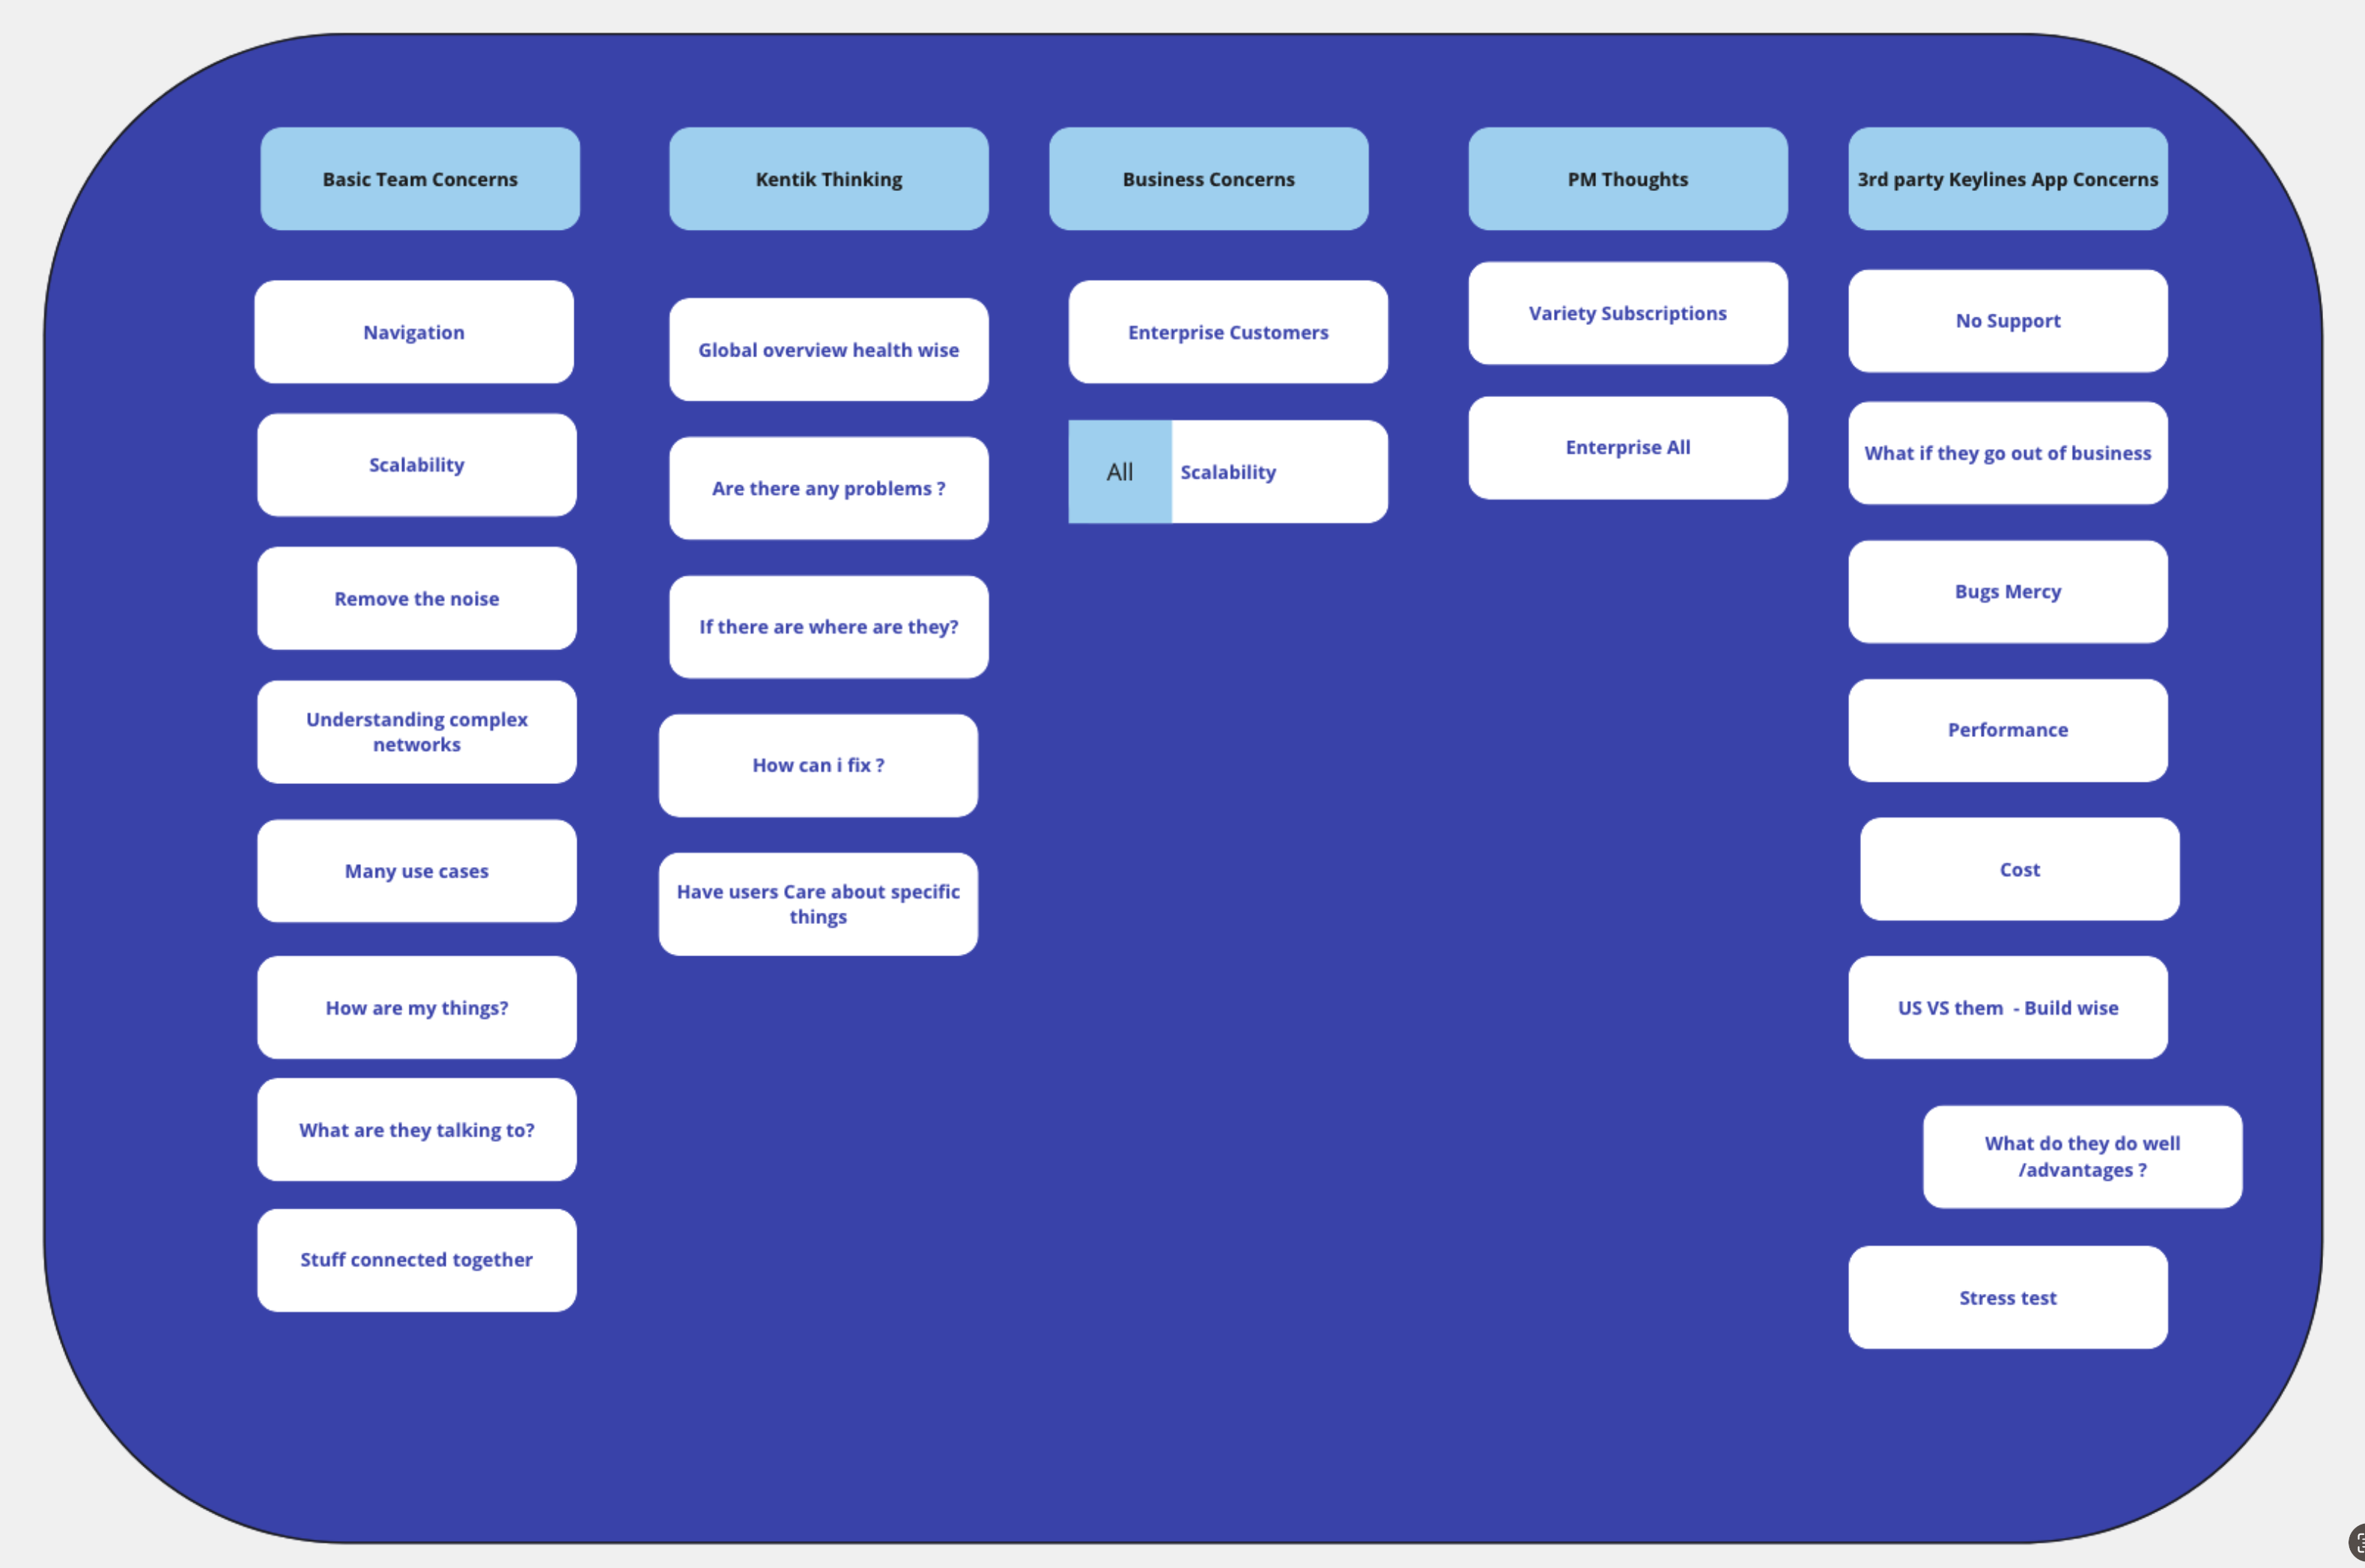
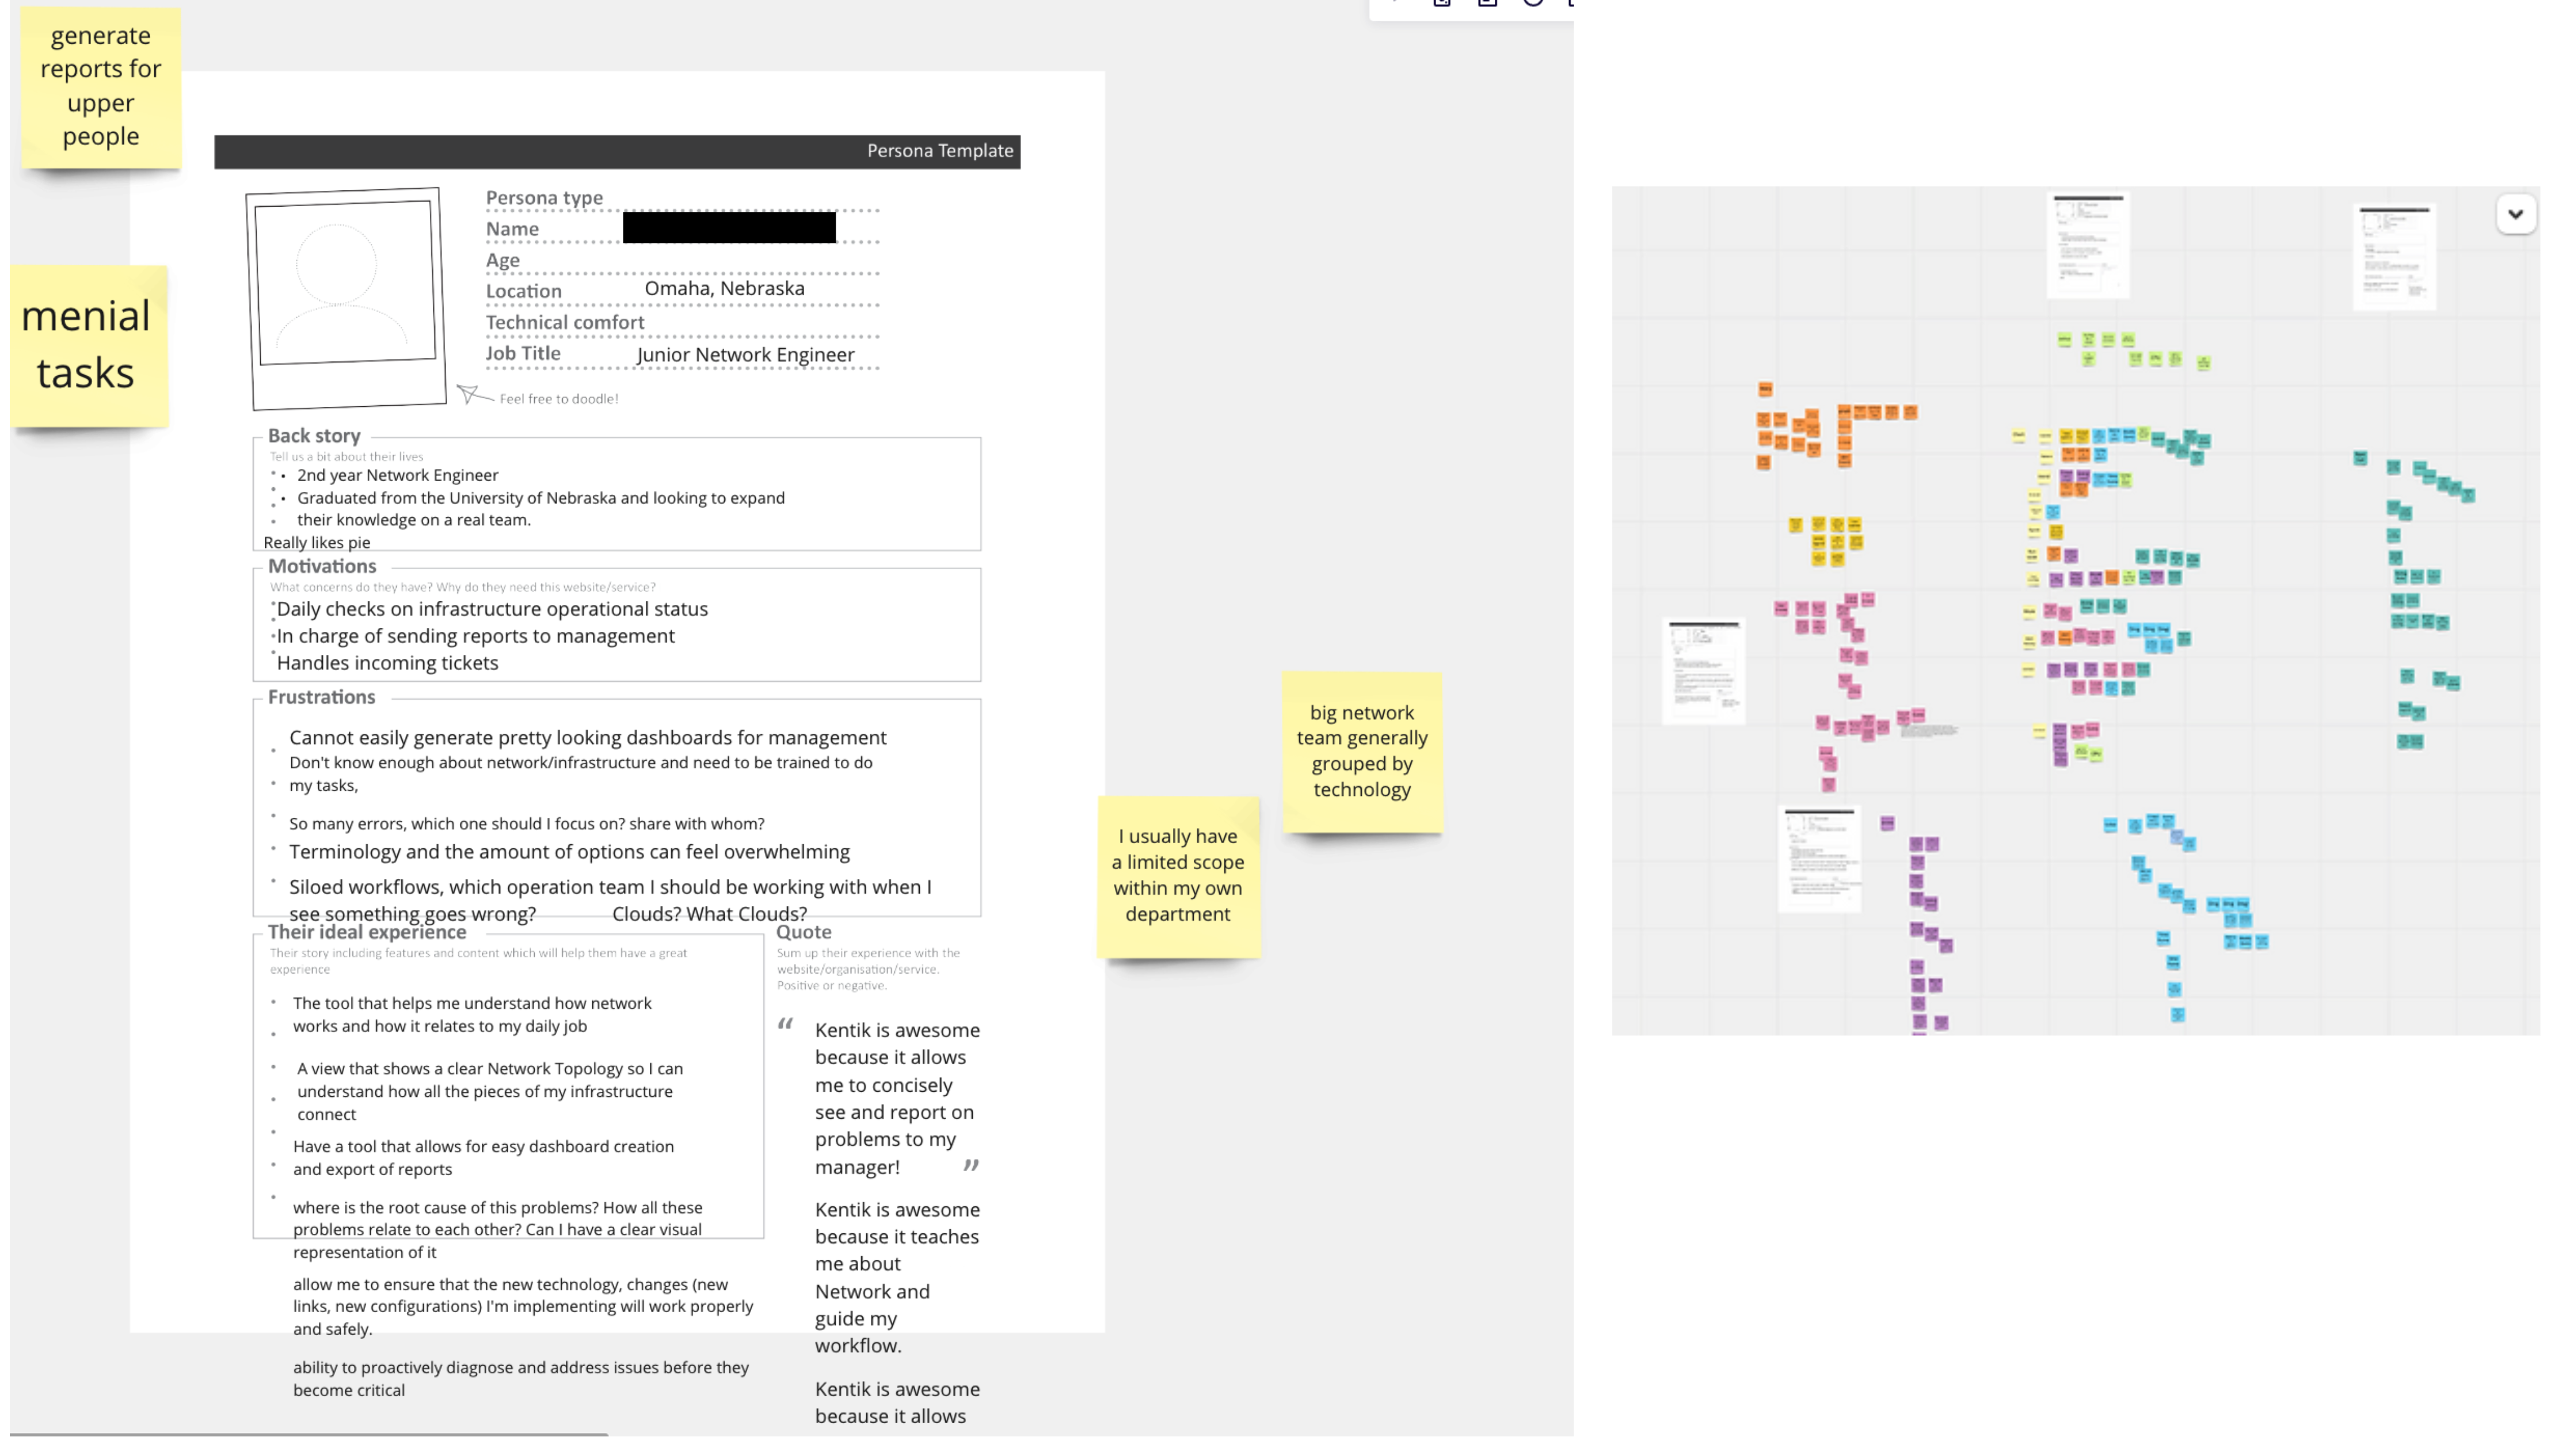
Insights from interviews with the VP, CTO, and management, grouped to clarify business concerns and align design priorities.I interviewed customers who were network engineers, uncovering insights that surprised our internal stakeholders and challenged their assumptions.
Collaboration & explanation
I worked with engineering, the PM, and design partners to turn those findings into three design priorities.
Connect all the components to see the big picture, and scale.
Find issues fast.
Understand the impact of deployments.
Sketches & drawing
“No more tables.”
Customer feedback during collaborative sketching
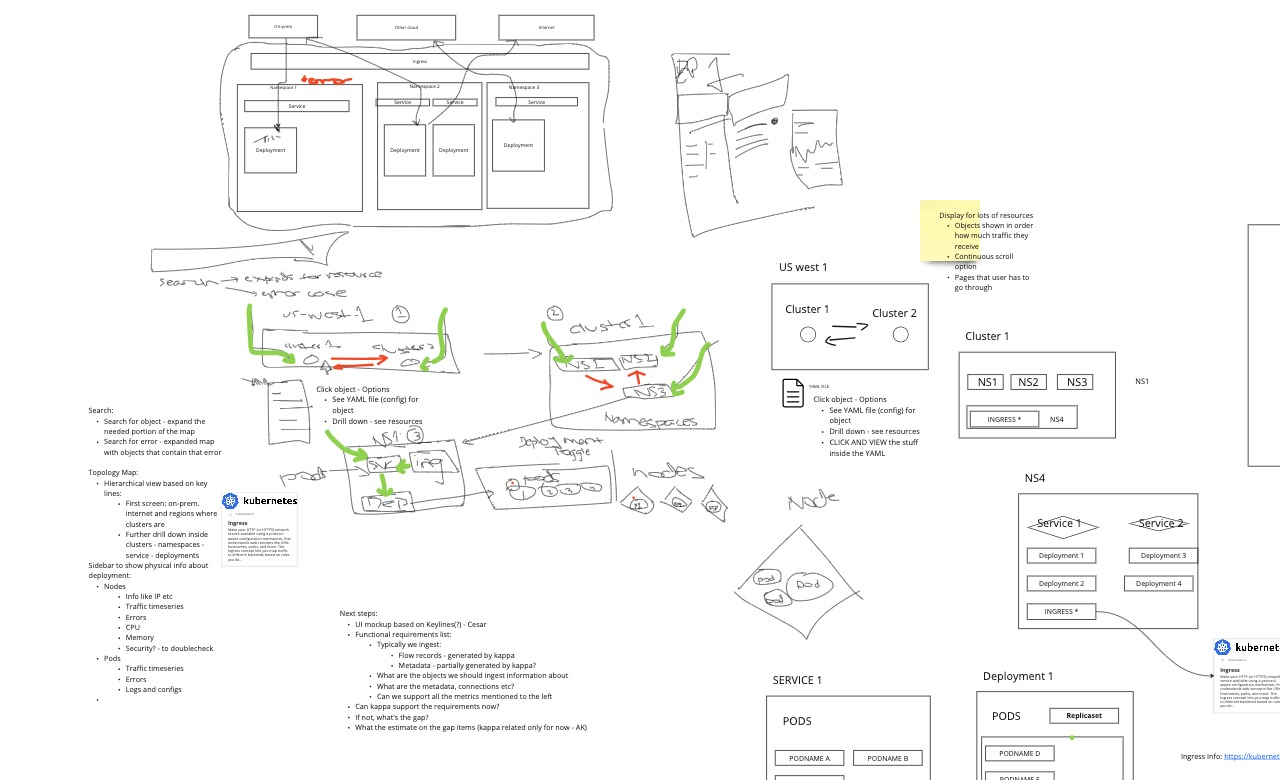
I asked customers to sketch their ideal solution and explain what they meant by ‘no more tables.’ Their sketches helped the team understand the Kubernetes hierarchy and why a visual approach mattered. Engineering also identified a key constraint: rendering hundreds of nodes.
The customers I interviewed drew what “no more tables” meant to them, making the Kubernetes hierarchy concrete for design and engineering.
Screen design in a mockup
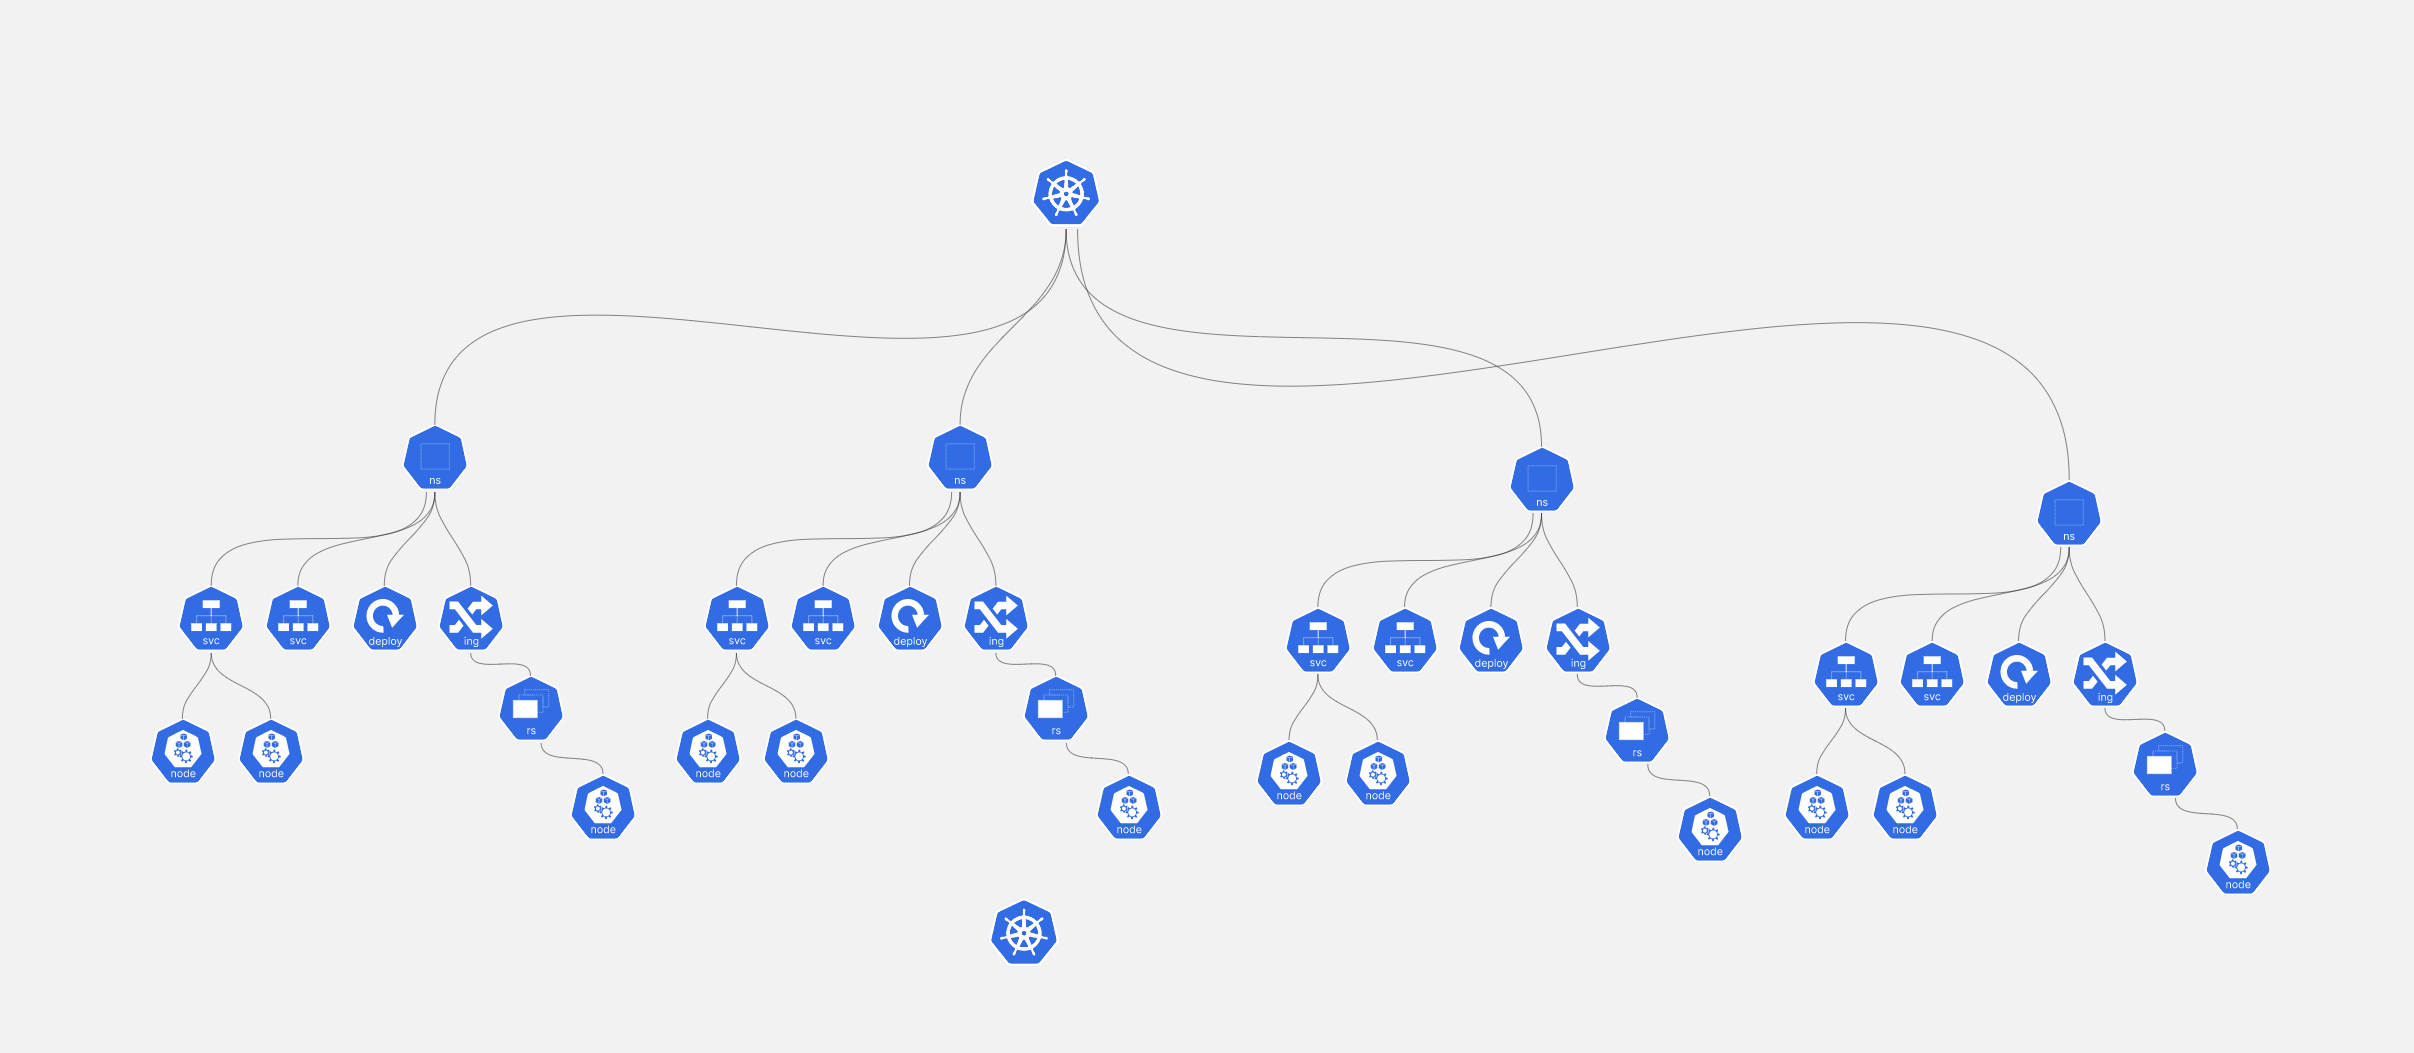
We translated the hierarchy into a visual topology, a node-based, hierarchical view of the cluster instead of a table.
The concept replaces a dense table with connected levels, helping engineers understand relationships before drilling into detail.
Wireframes
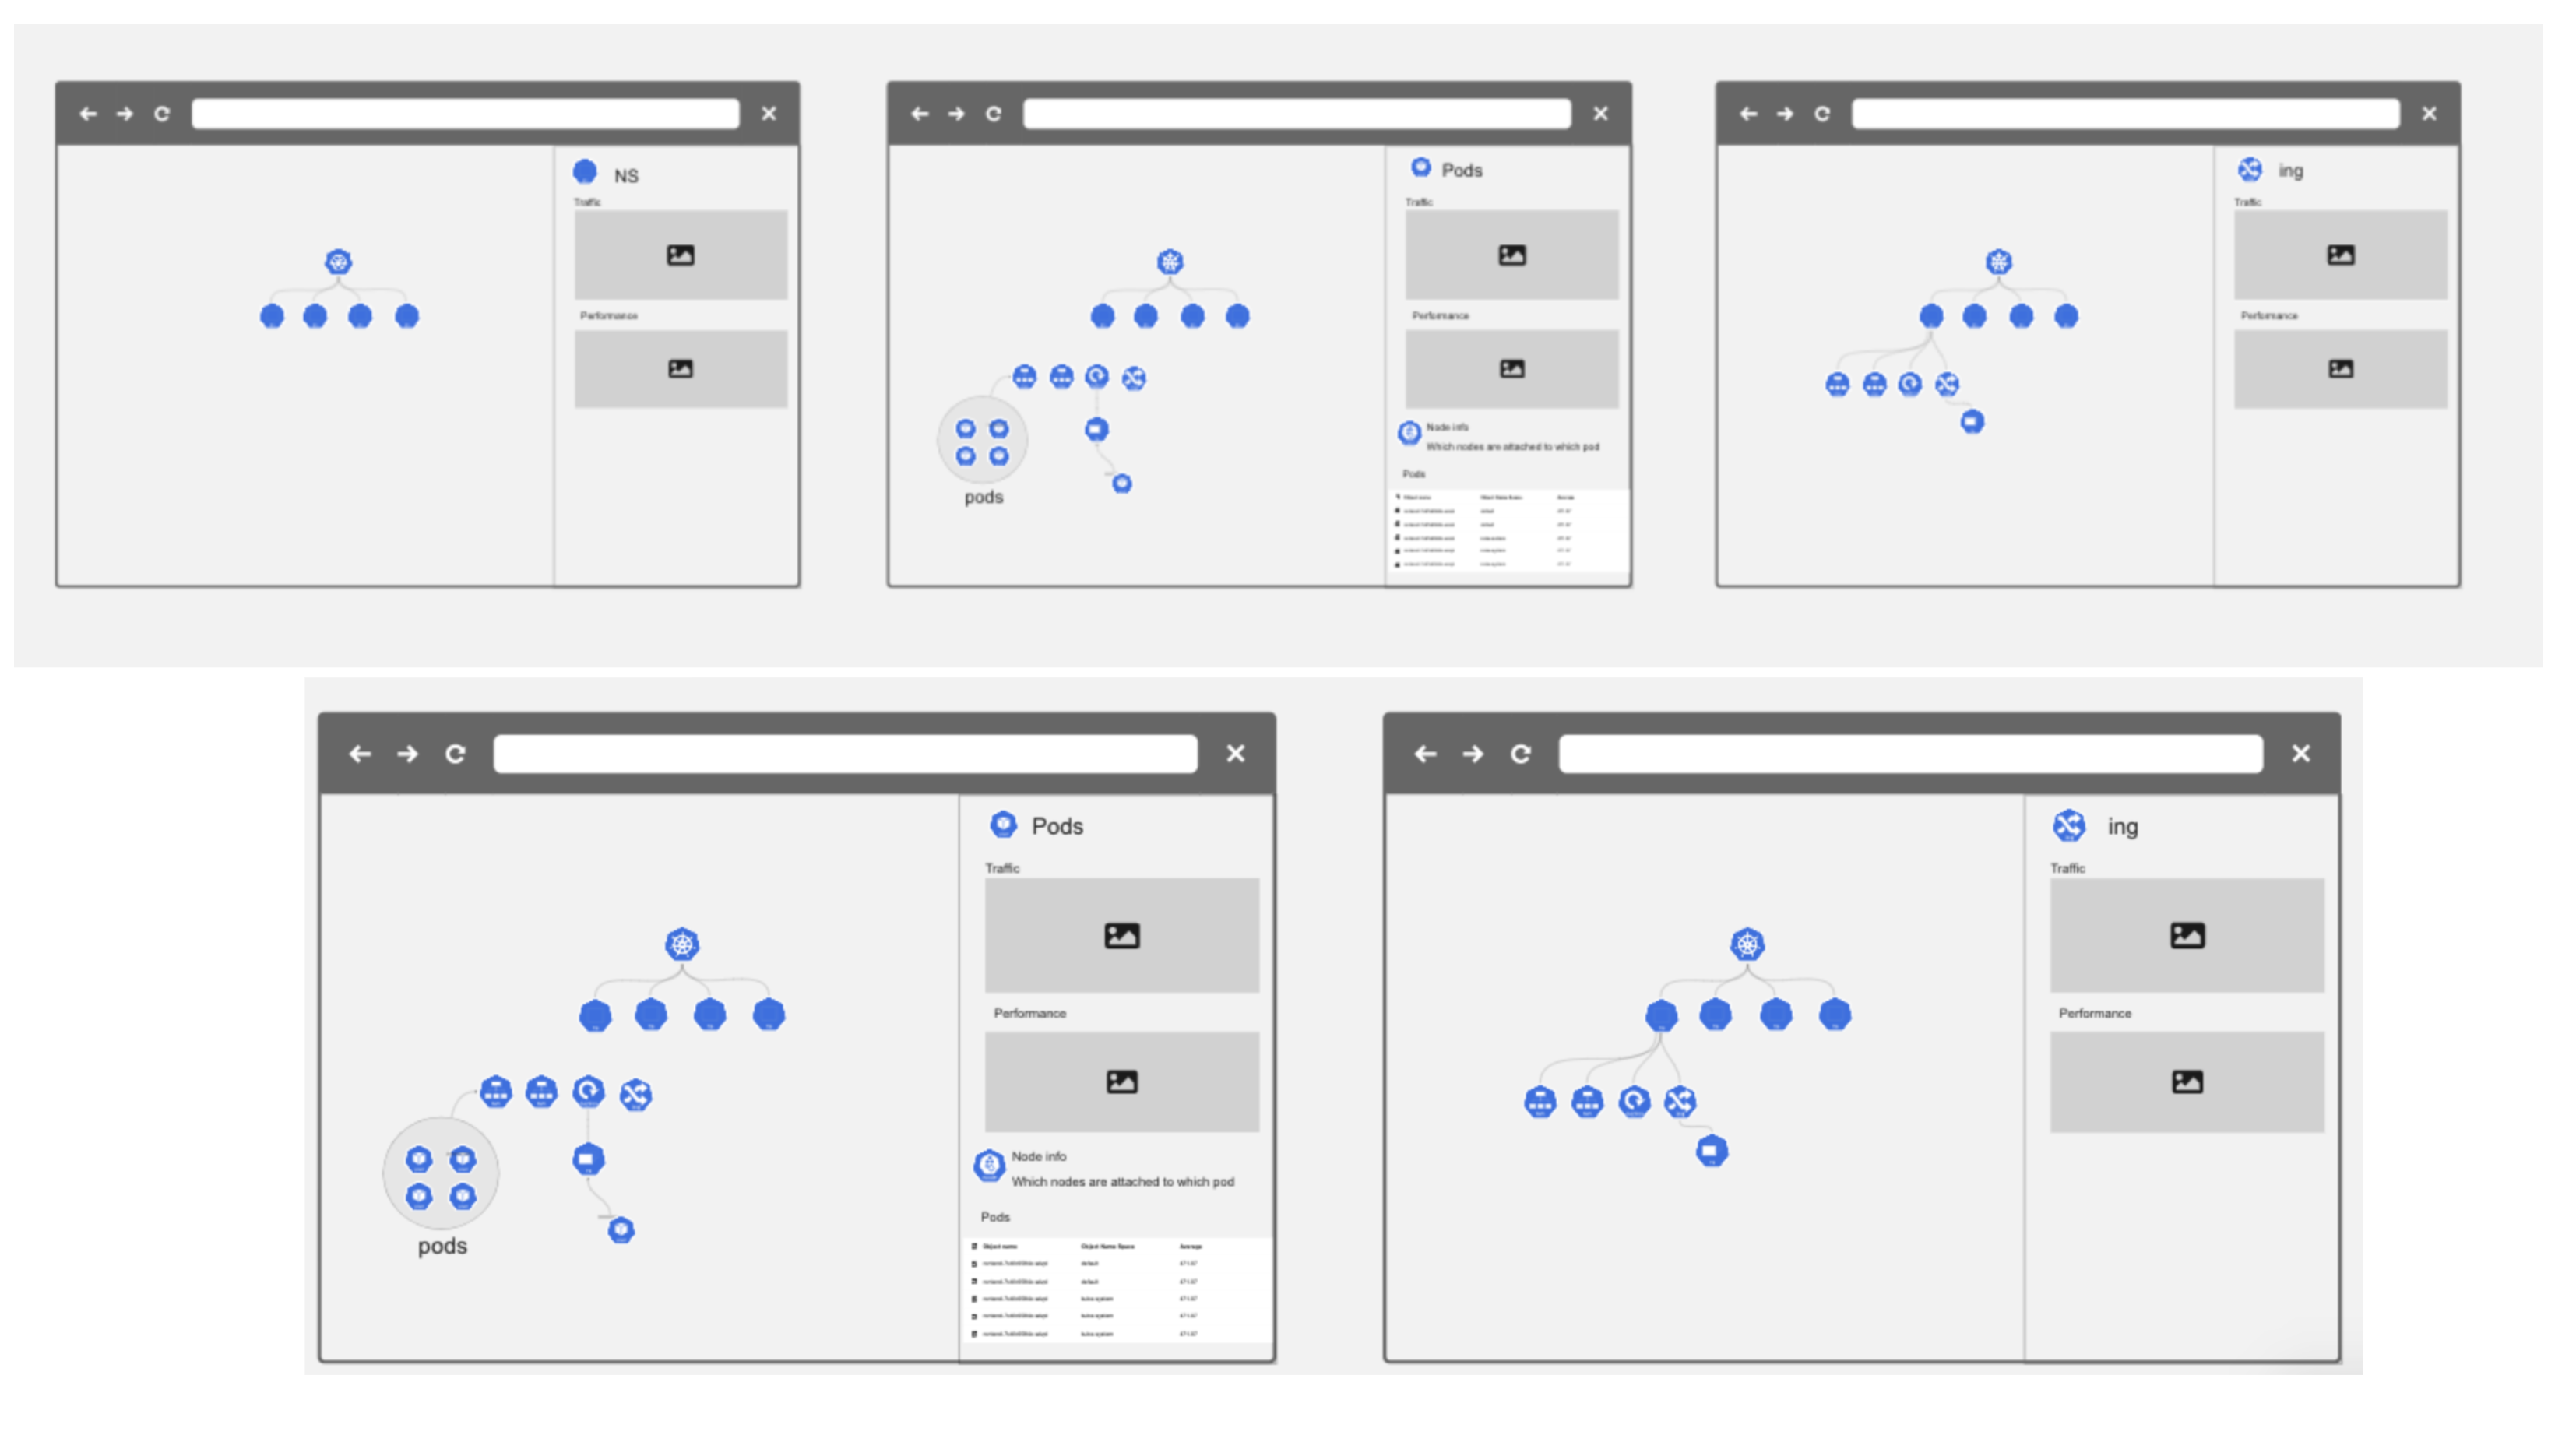
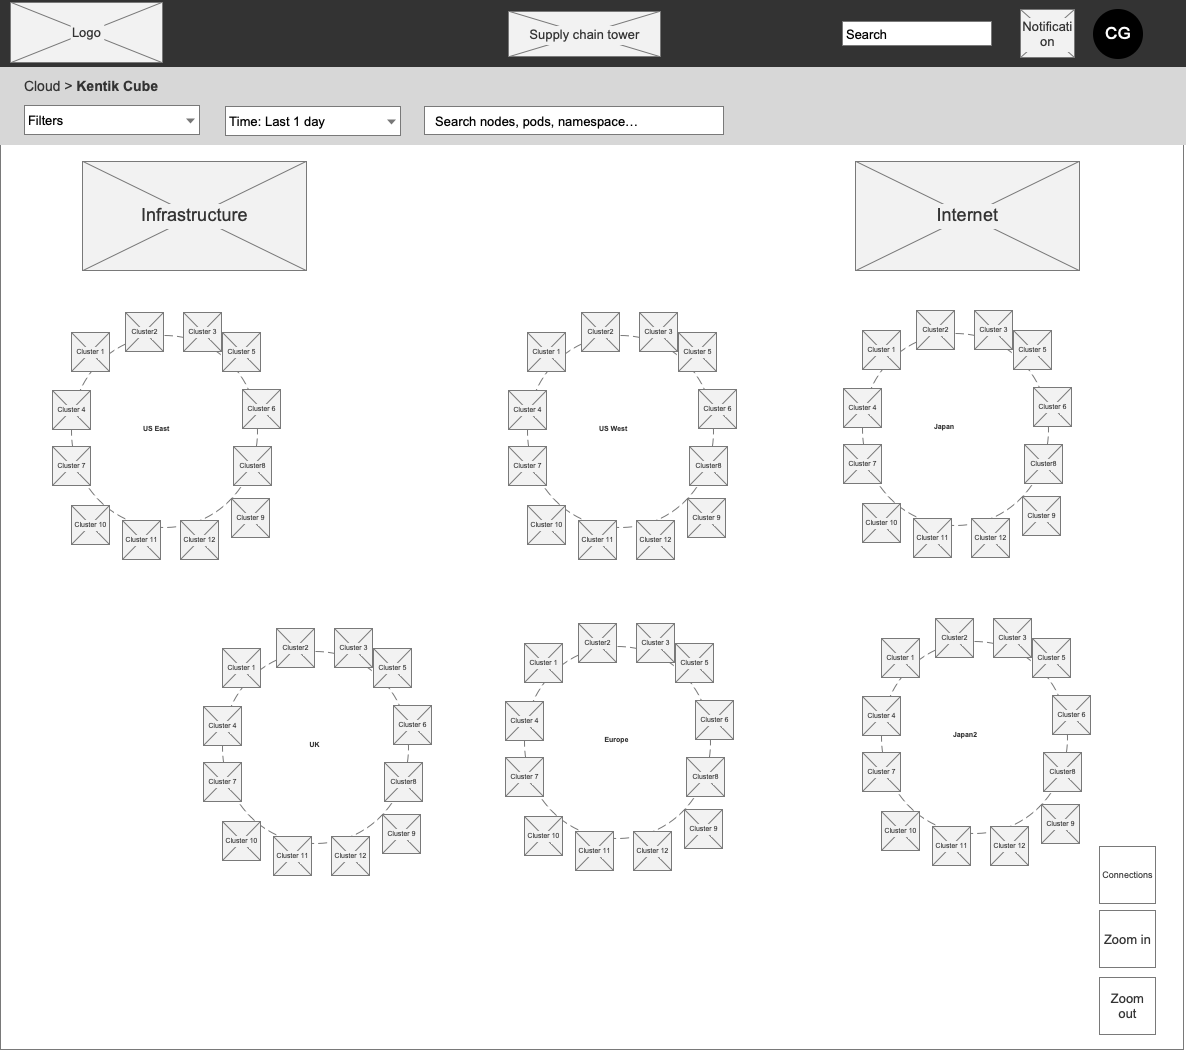
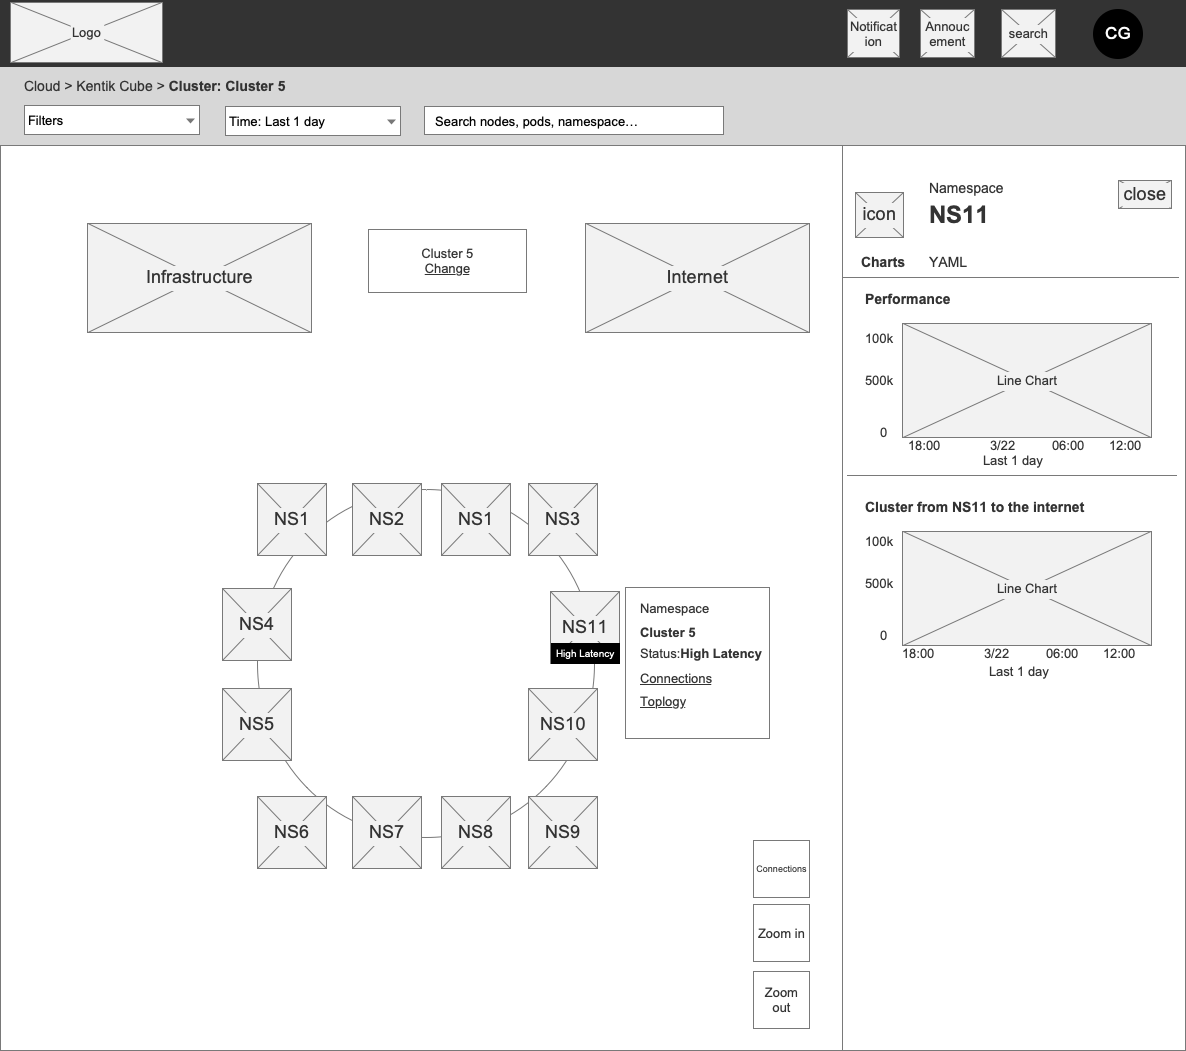
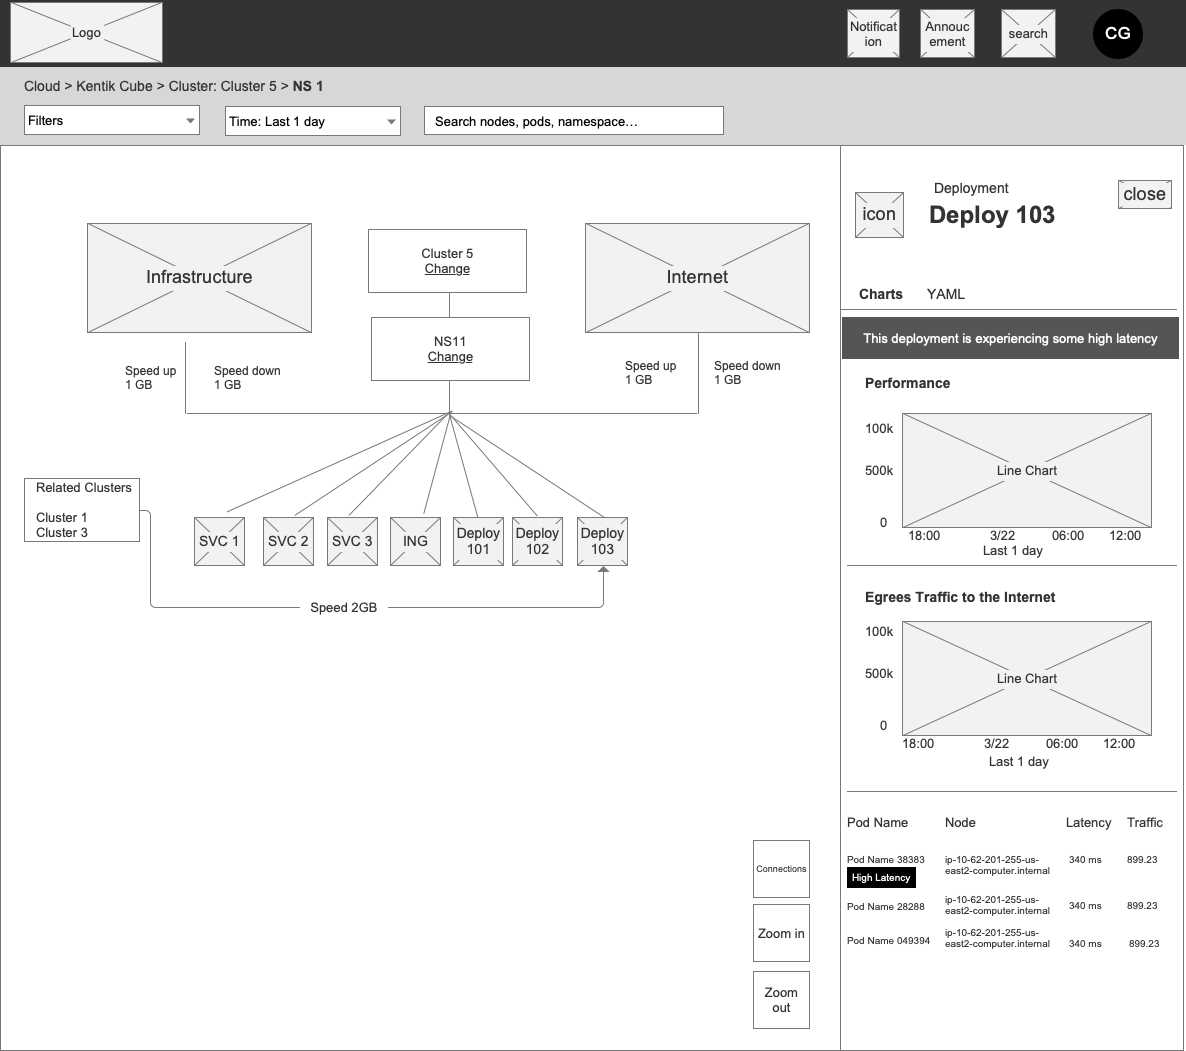
I switched to wireframes to separate information architecture from visual styling. This helped stakeholders agree on the topology layout, hierarchy, and placement of detail.
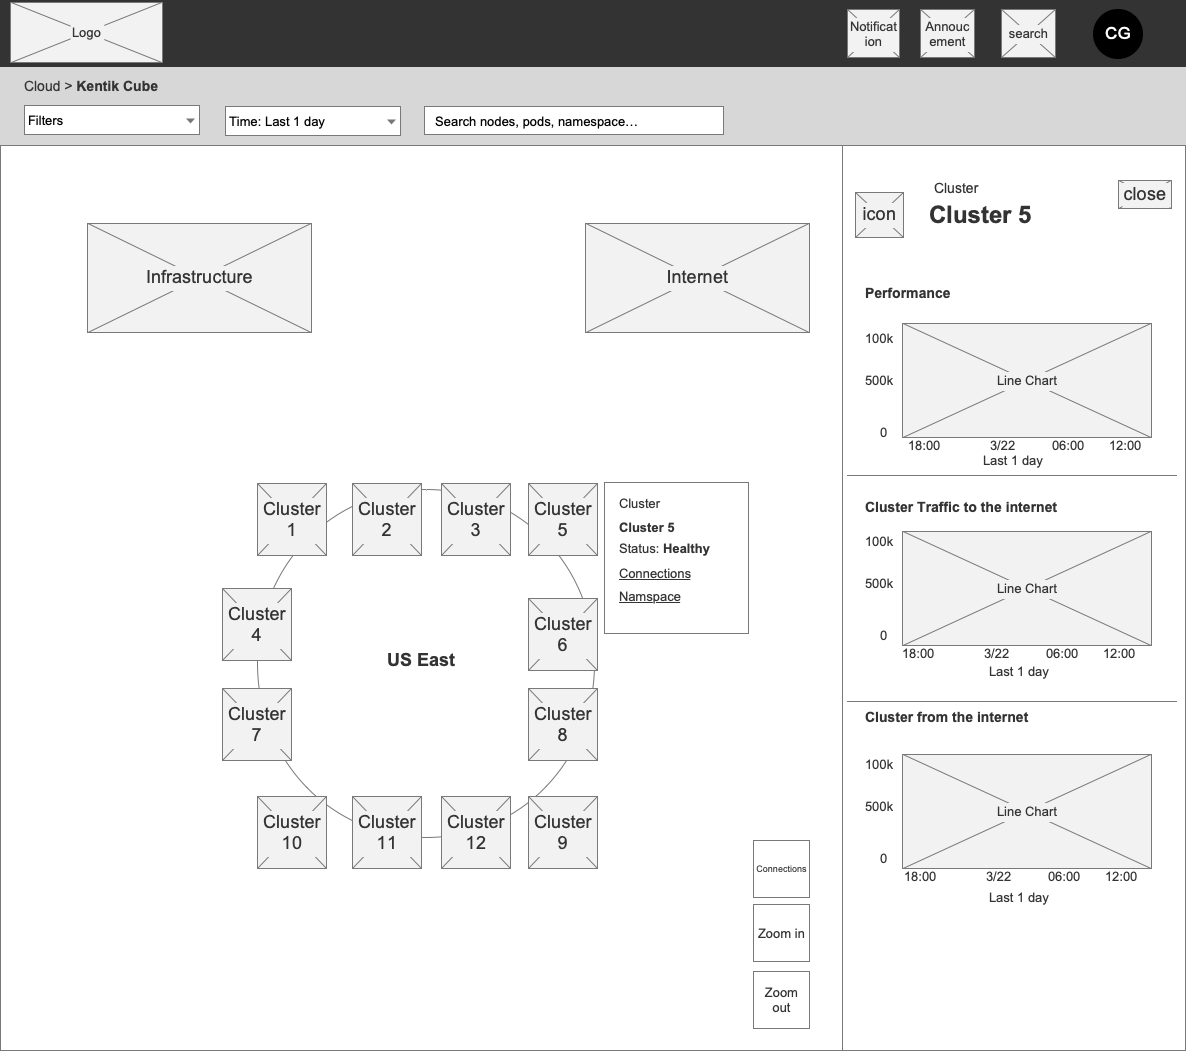
Wireframes separated layout decisions from visual styling; the canvas and detail drawer made the hierarchy easier to agree on.
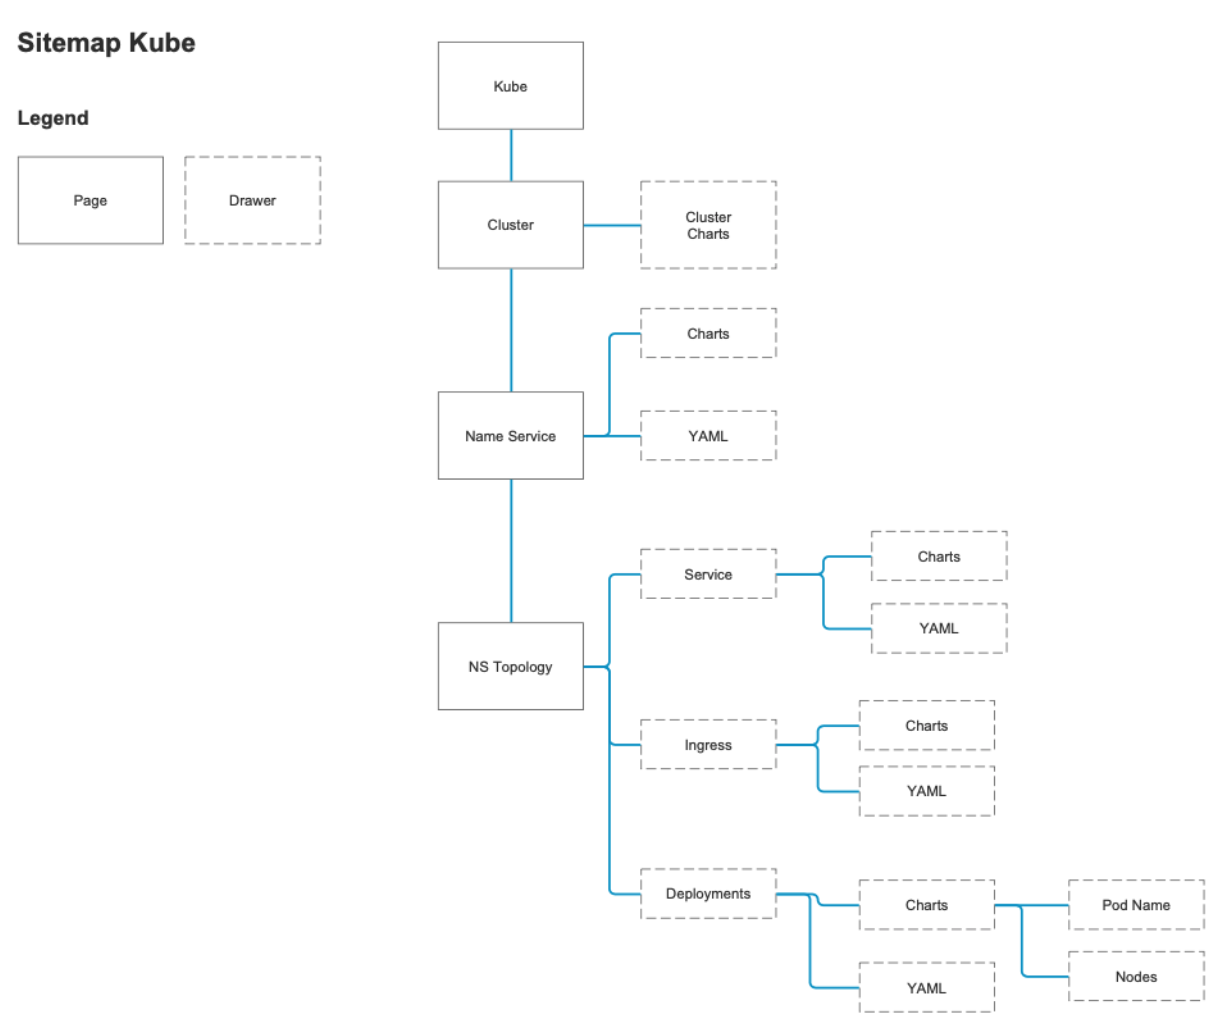
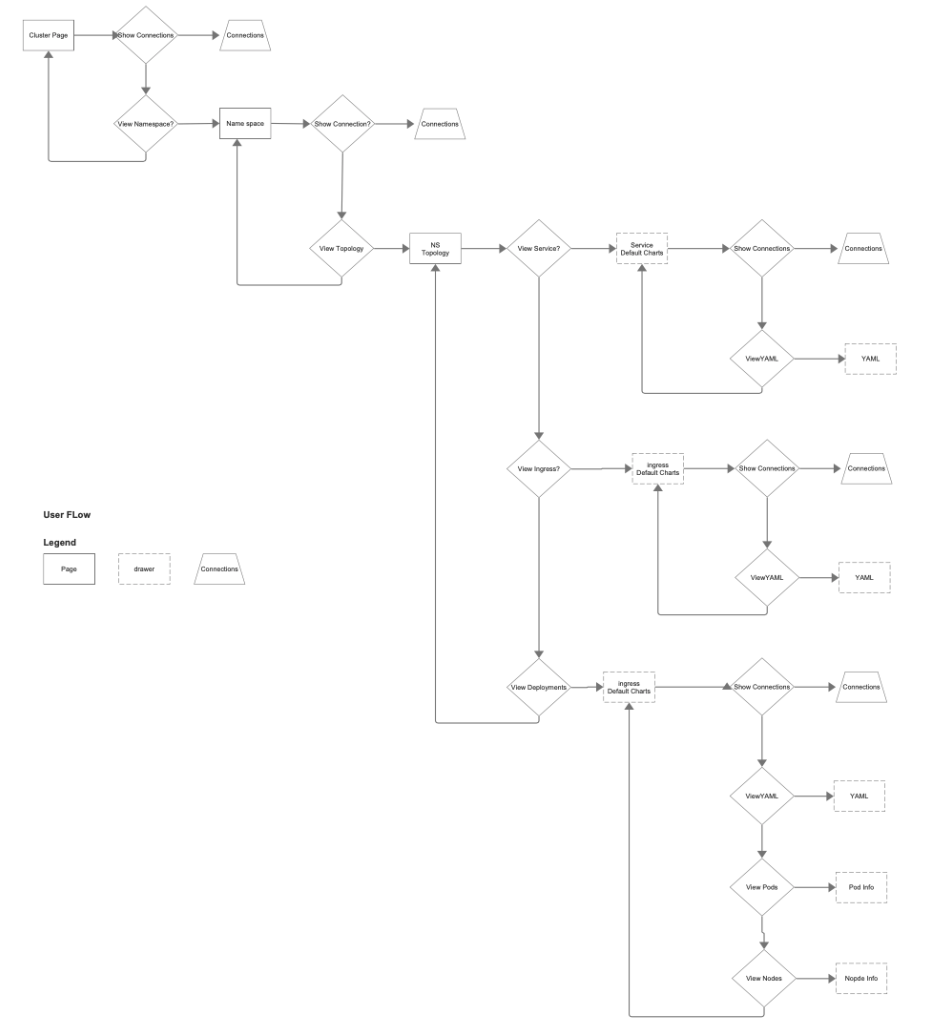
The sitemap organizes the levels of network exploration so the team could align on where information belongs.The user flow maps the investigation path across levels, giving the team a common structure for navigation.
DESIGN DEVELOPMENT · WIREFRAMES
Final wireframes
Release scope: these wireframes document the agreed direction, including pod detail that was deferred from MVP and built afterward.
The agreed direction: a cluster-overview canvas that drills from clusters → namespaces → deployments, with a right-side drawer carrying performance, traffic, and pod detail at every level, and high-latency states flagged inline.
An overview across regions establishes the big picture before the user drills into a cluster.
The detail drawer pairs cluster context with performance information without replacing the topology view.
High-latency states appear inline so users can identify the next area to investigate.
The proposed deployment view places pods in the detail drawer. All pod views were deferred from MVP and built after MVP.
1 / 4
Picking your battles mattered here. I let some things go, like showing region in the breadcrumb, so we could focus on the bigger picture and ship on time. Those went to the backlog.
04 · Designs
The final topology experience
SHIPPED PRODUCT
The final designs shown below shipped to customers across MVP and subsequent releases. Pod views were added after MVP.
The decision: use an infinite topology canvas with a persistent detail drawer. Customers could follow relationships across clusters, namespaces, and deployments while keeping performance data in context.
Checking feasibility: engineering wanted to see whether hundreds of nodes could fit in the canvas. I made the concept concrete through the design, which engineering used to build and test a view containing hundreds of nodes. That test confirmed the approach was feasible.
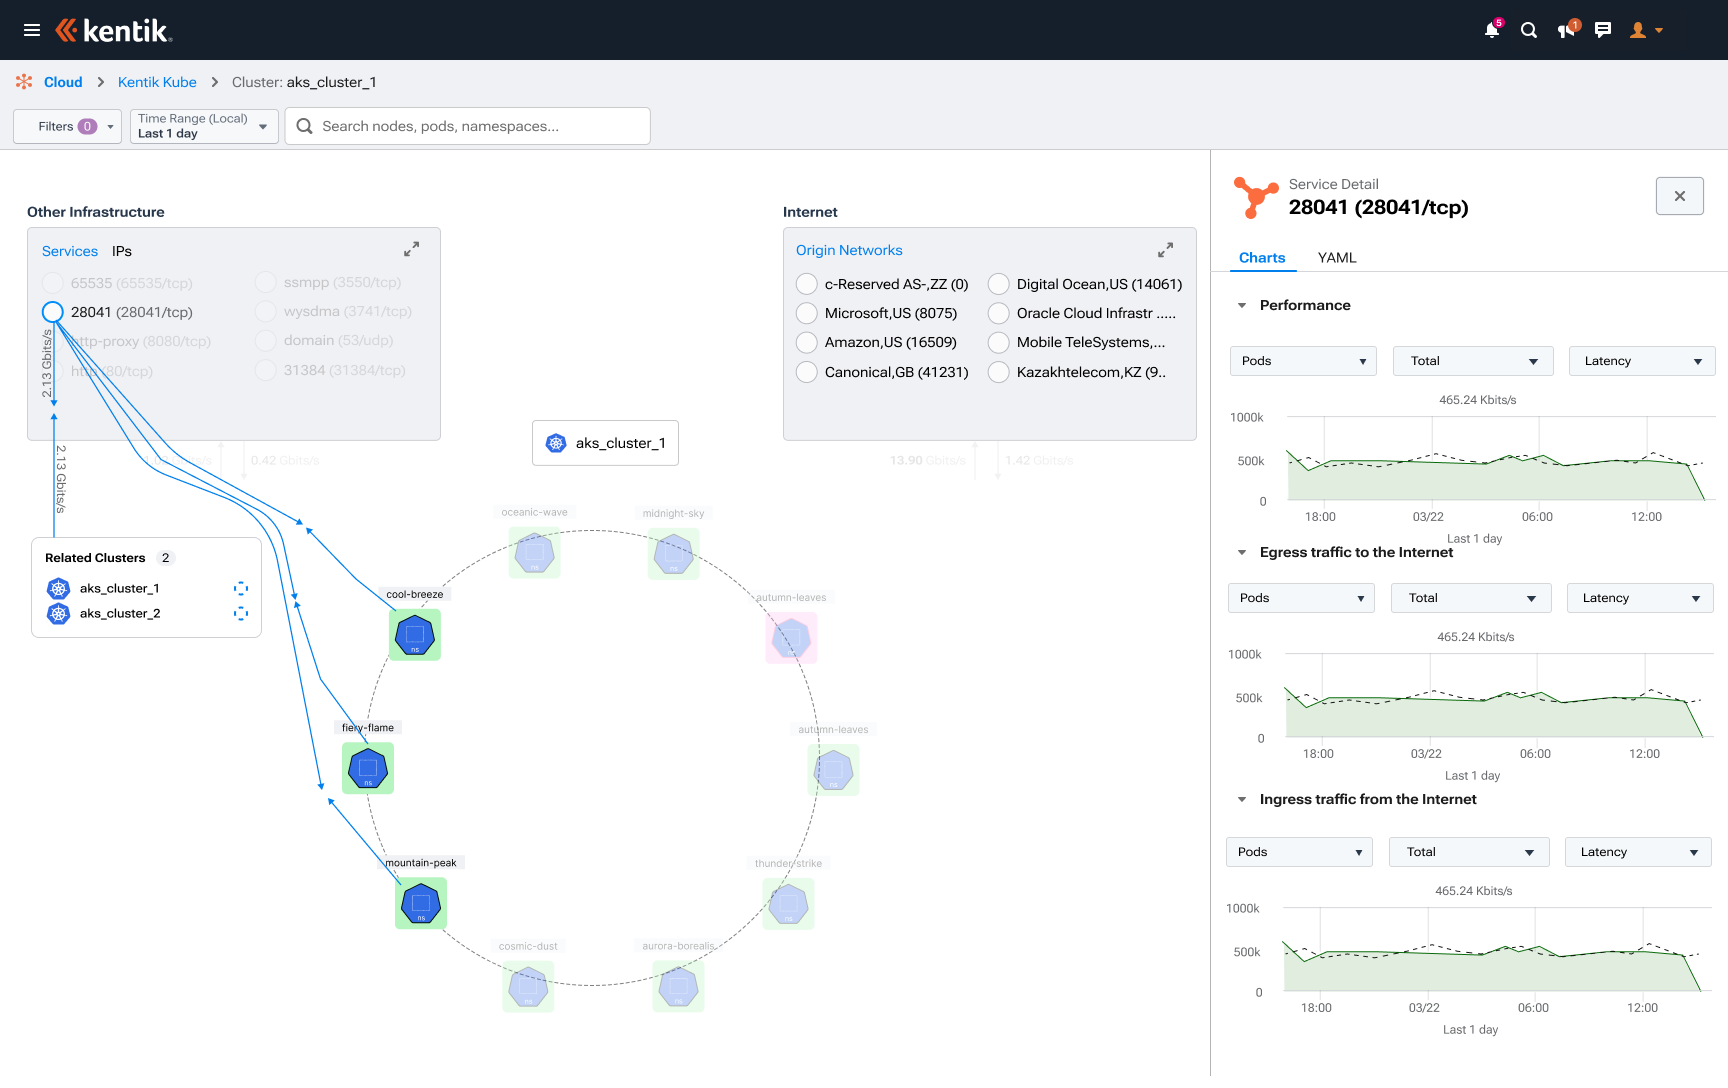
The infinite topology canvas shows network relationships while the adjacent drawer keeps performance and traffic charts in context.
Contextual cluster actions offer two clear paths: reveal connections or explore namespaces.
Showing traffic volumes on connections helps users investigate relationships between clusters and the internet.
Namespaces appear around the selected cluster, preserving their relationship to the parent as users explore.
An unhealthy namespace is flagged on the canvas; supporting charts remain available in the drawer.
Service detail stays connected to related clusters and live connections, supporting investigation across objects.
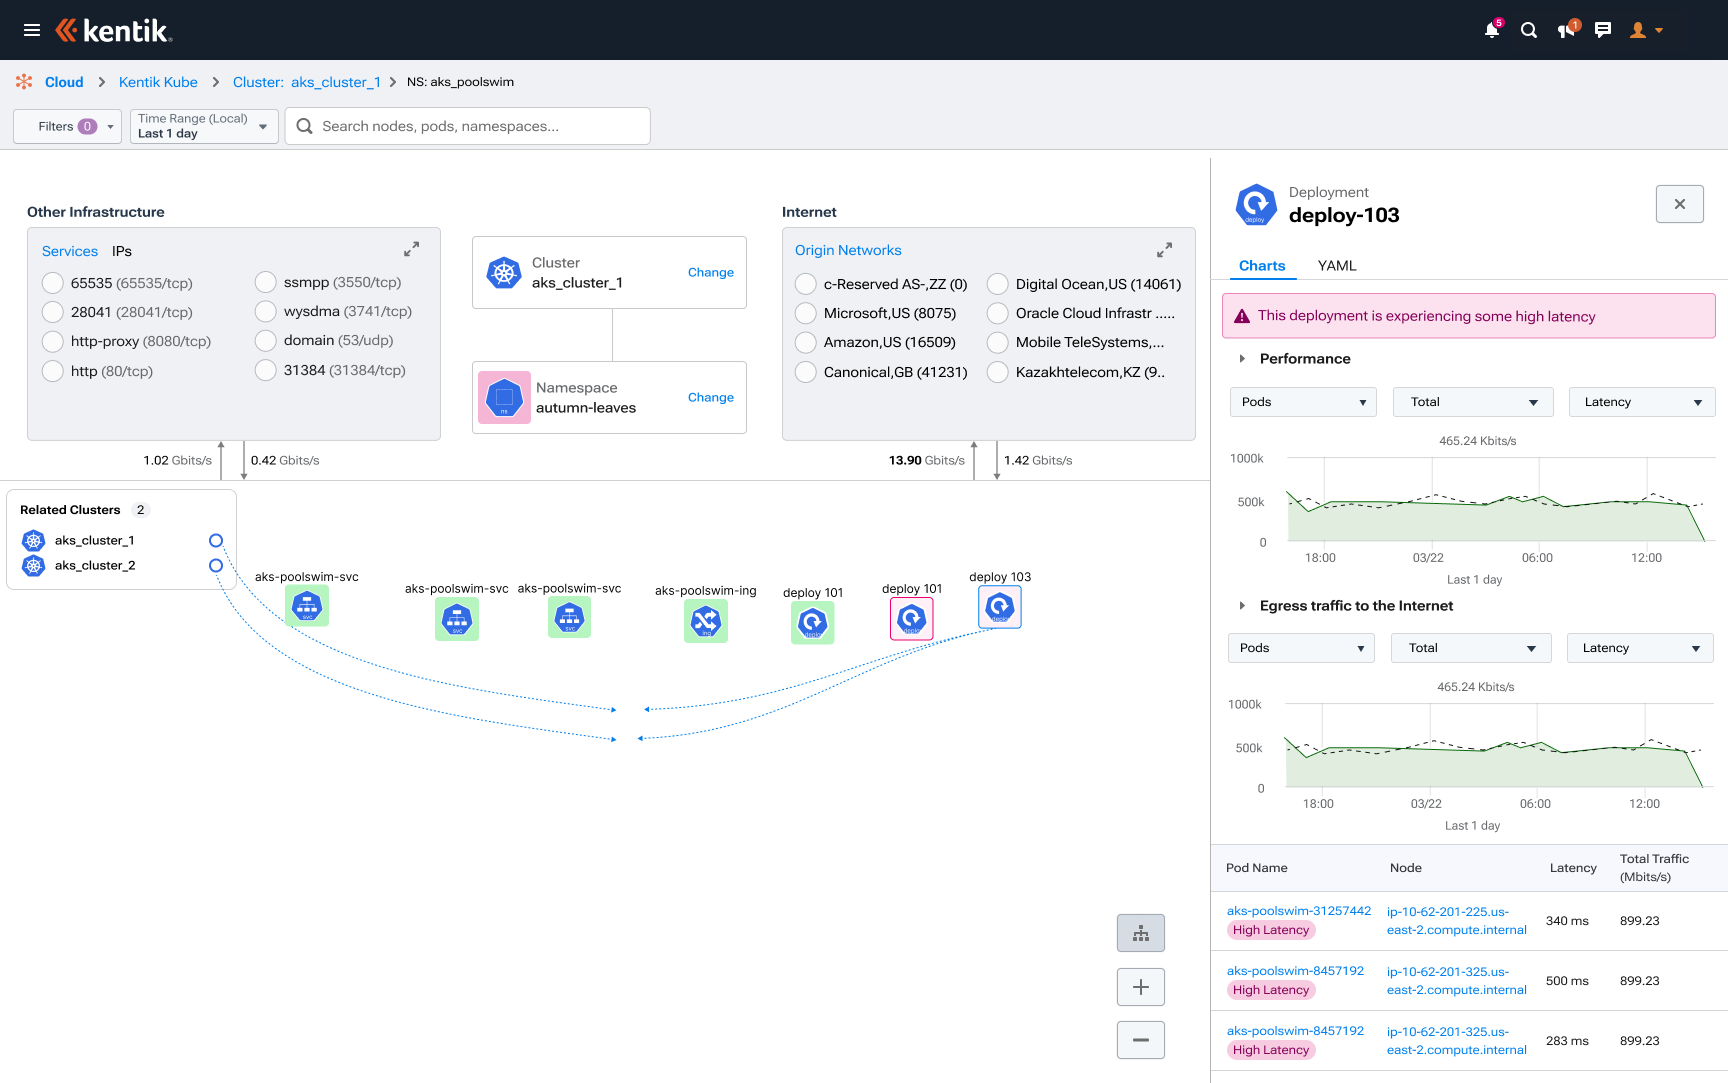
Pod-level latency appears in the drawer, keeping detailed diagnostics available without crowding the main hierarchy.
An inline unhealthy state identifies the deployment that needs follow-up without requiring a separate table search.
The infinite canvas accommodates the expanded deployment graph so engineers can see the broader topology.
1 / 9
05 · Results
Results & impact
I can finally see it so easily and show my team the issues at every level.
Oil & Gas product managers / lead engineers
CUSTOMER-REPORTED · ISSUE LOCATION
Hours to minutes
Customer cloud engineers reported that locating network issues had taken hours of searching through table pages, sometimes across thousands of nodes. The topology view made the issue’s location visible, bringing that task down to minutes.
Customer PMs could share a screenshot or point engineers to a region on the map, giving them a common reference for investigation and action.
BUSINESS IMPACT
$10M+ in closed product sales
Sales reported completed customer purchases totaling more than $10 million following KubeCon demos and the product launch. Prospective customers saw the experience demonstrated and purchased licenses.
Product sales exceeded the forecast
Sales reported five to six customer purchases per month against a forecast of one. Buyers included existing Kentik customers adding the Kubernetes product and brand-new customers.
Adoption spread within customer accounts
Customer account records showed organizations adding more people, and Pendo confirmed active use by those additional users. Alongside engineers sharing the experience with colleagues, this showed adoption spreading within existing customer organizations.
Better deployment coordination
Visibility across deployments helped PMs and engineering teams coordinate changes and avoid conflicts.
INFLUENCE BEYOND KUBERNETES
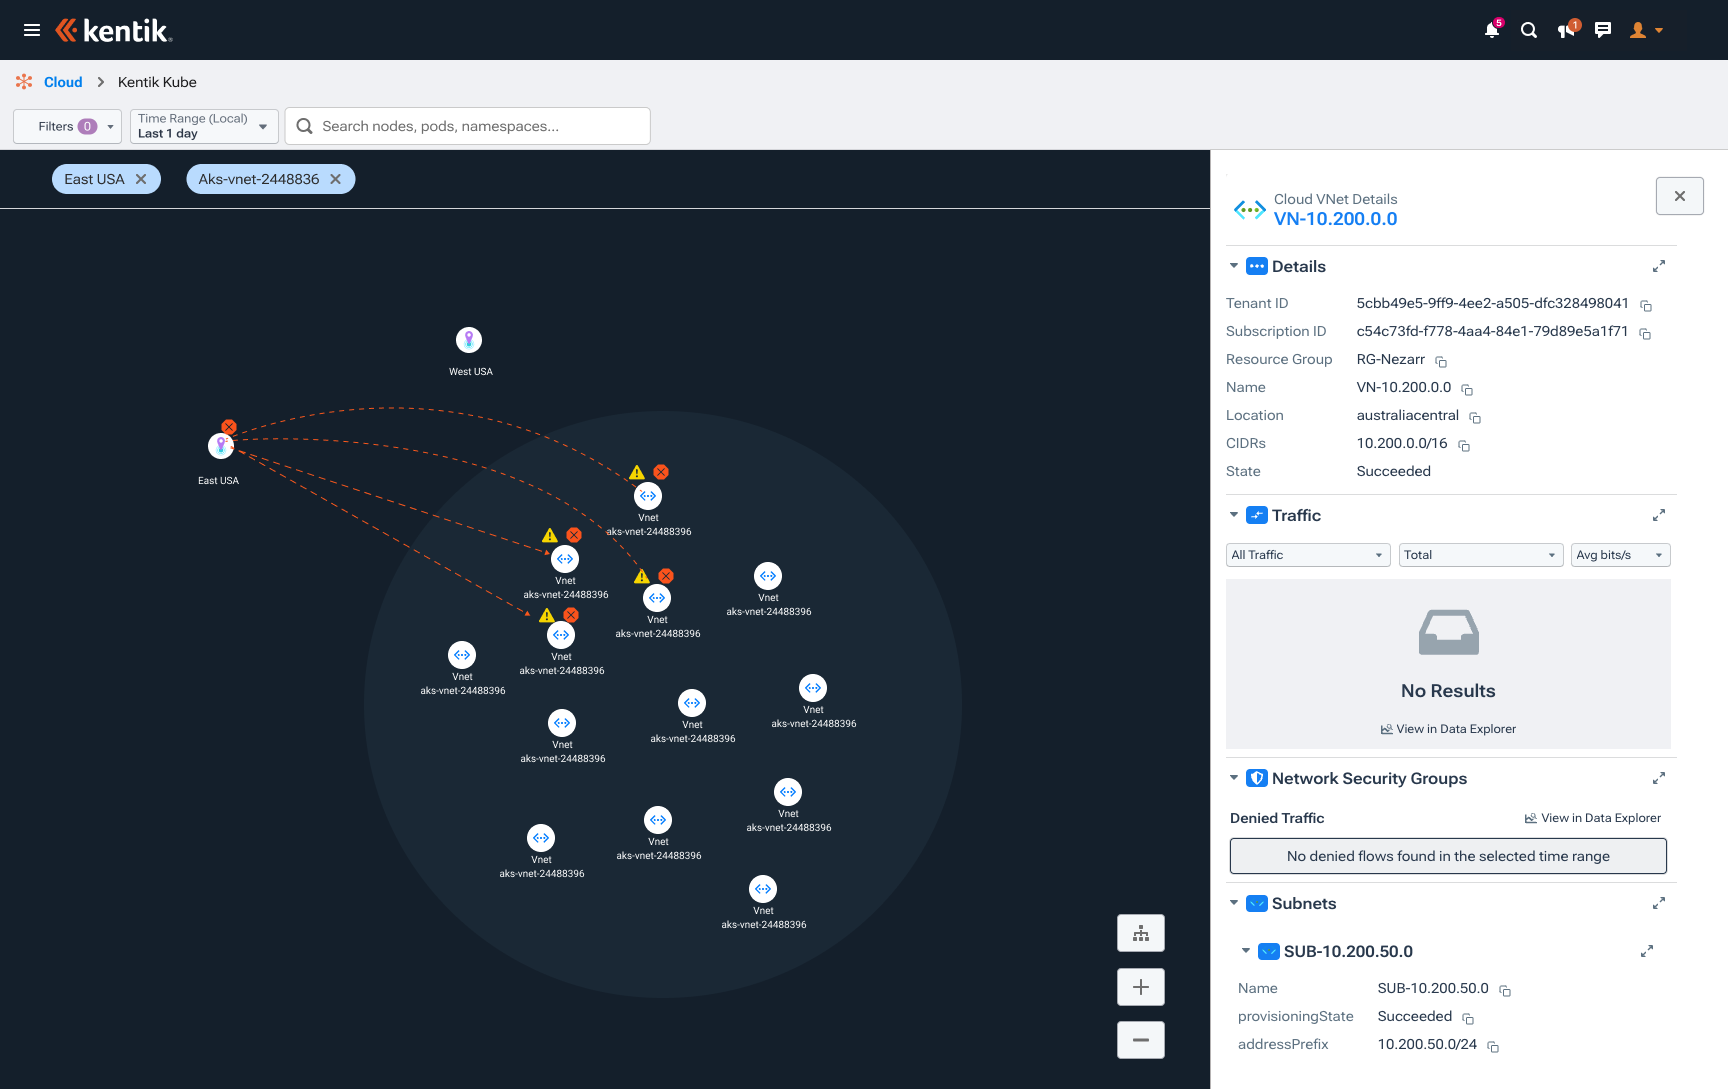
The topology canvas and detail-drawer pattern became a foundation for Kentik’s Azure and AWS experiences, extending the design’s impact across the cloud product portfolio.
Refined through customer feedback
After launch, I used Pendo analytics, surveys, and direct customer conversations to guide continued improvements to the experience.
The refined canvas-and-drawer pattern extends to Azure, carrying resource detail into another cloud environment.NEXT PROJECT