Thousands of assets
Tracked across industries, from first responders and plumbers to the City of Los Angeles.
A 0 to 1 fleet management SaaS product, built as the first hire, with customers as design partners.
Fleet teams struggled to locate their assets, understand vehicle status, and coordinate across operating locations. Customer workshops revealed frustration with clunky dashboards and inaccurate information, alongside hesitation to trust another technology platform.
Founding Product Designer
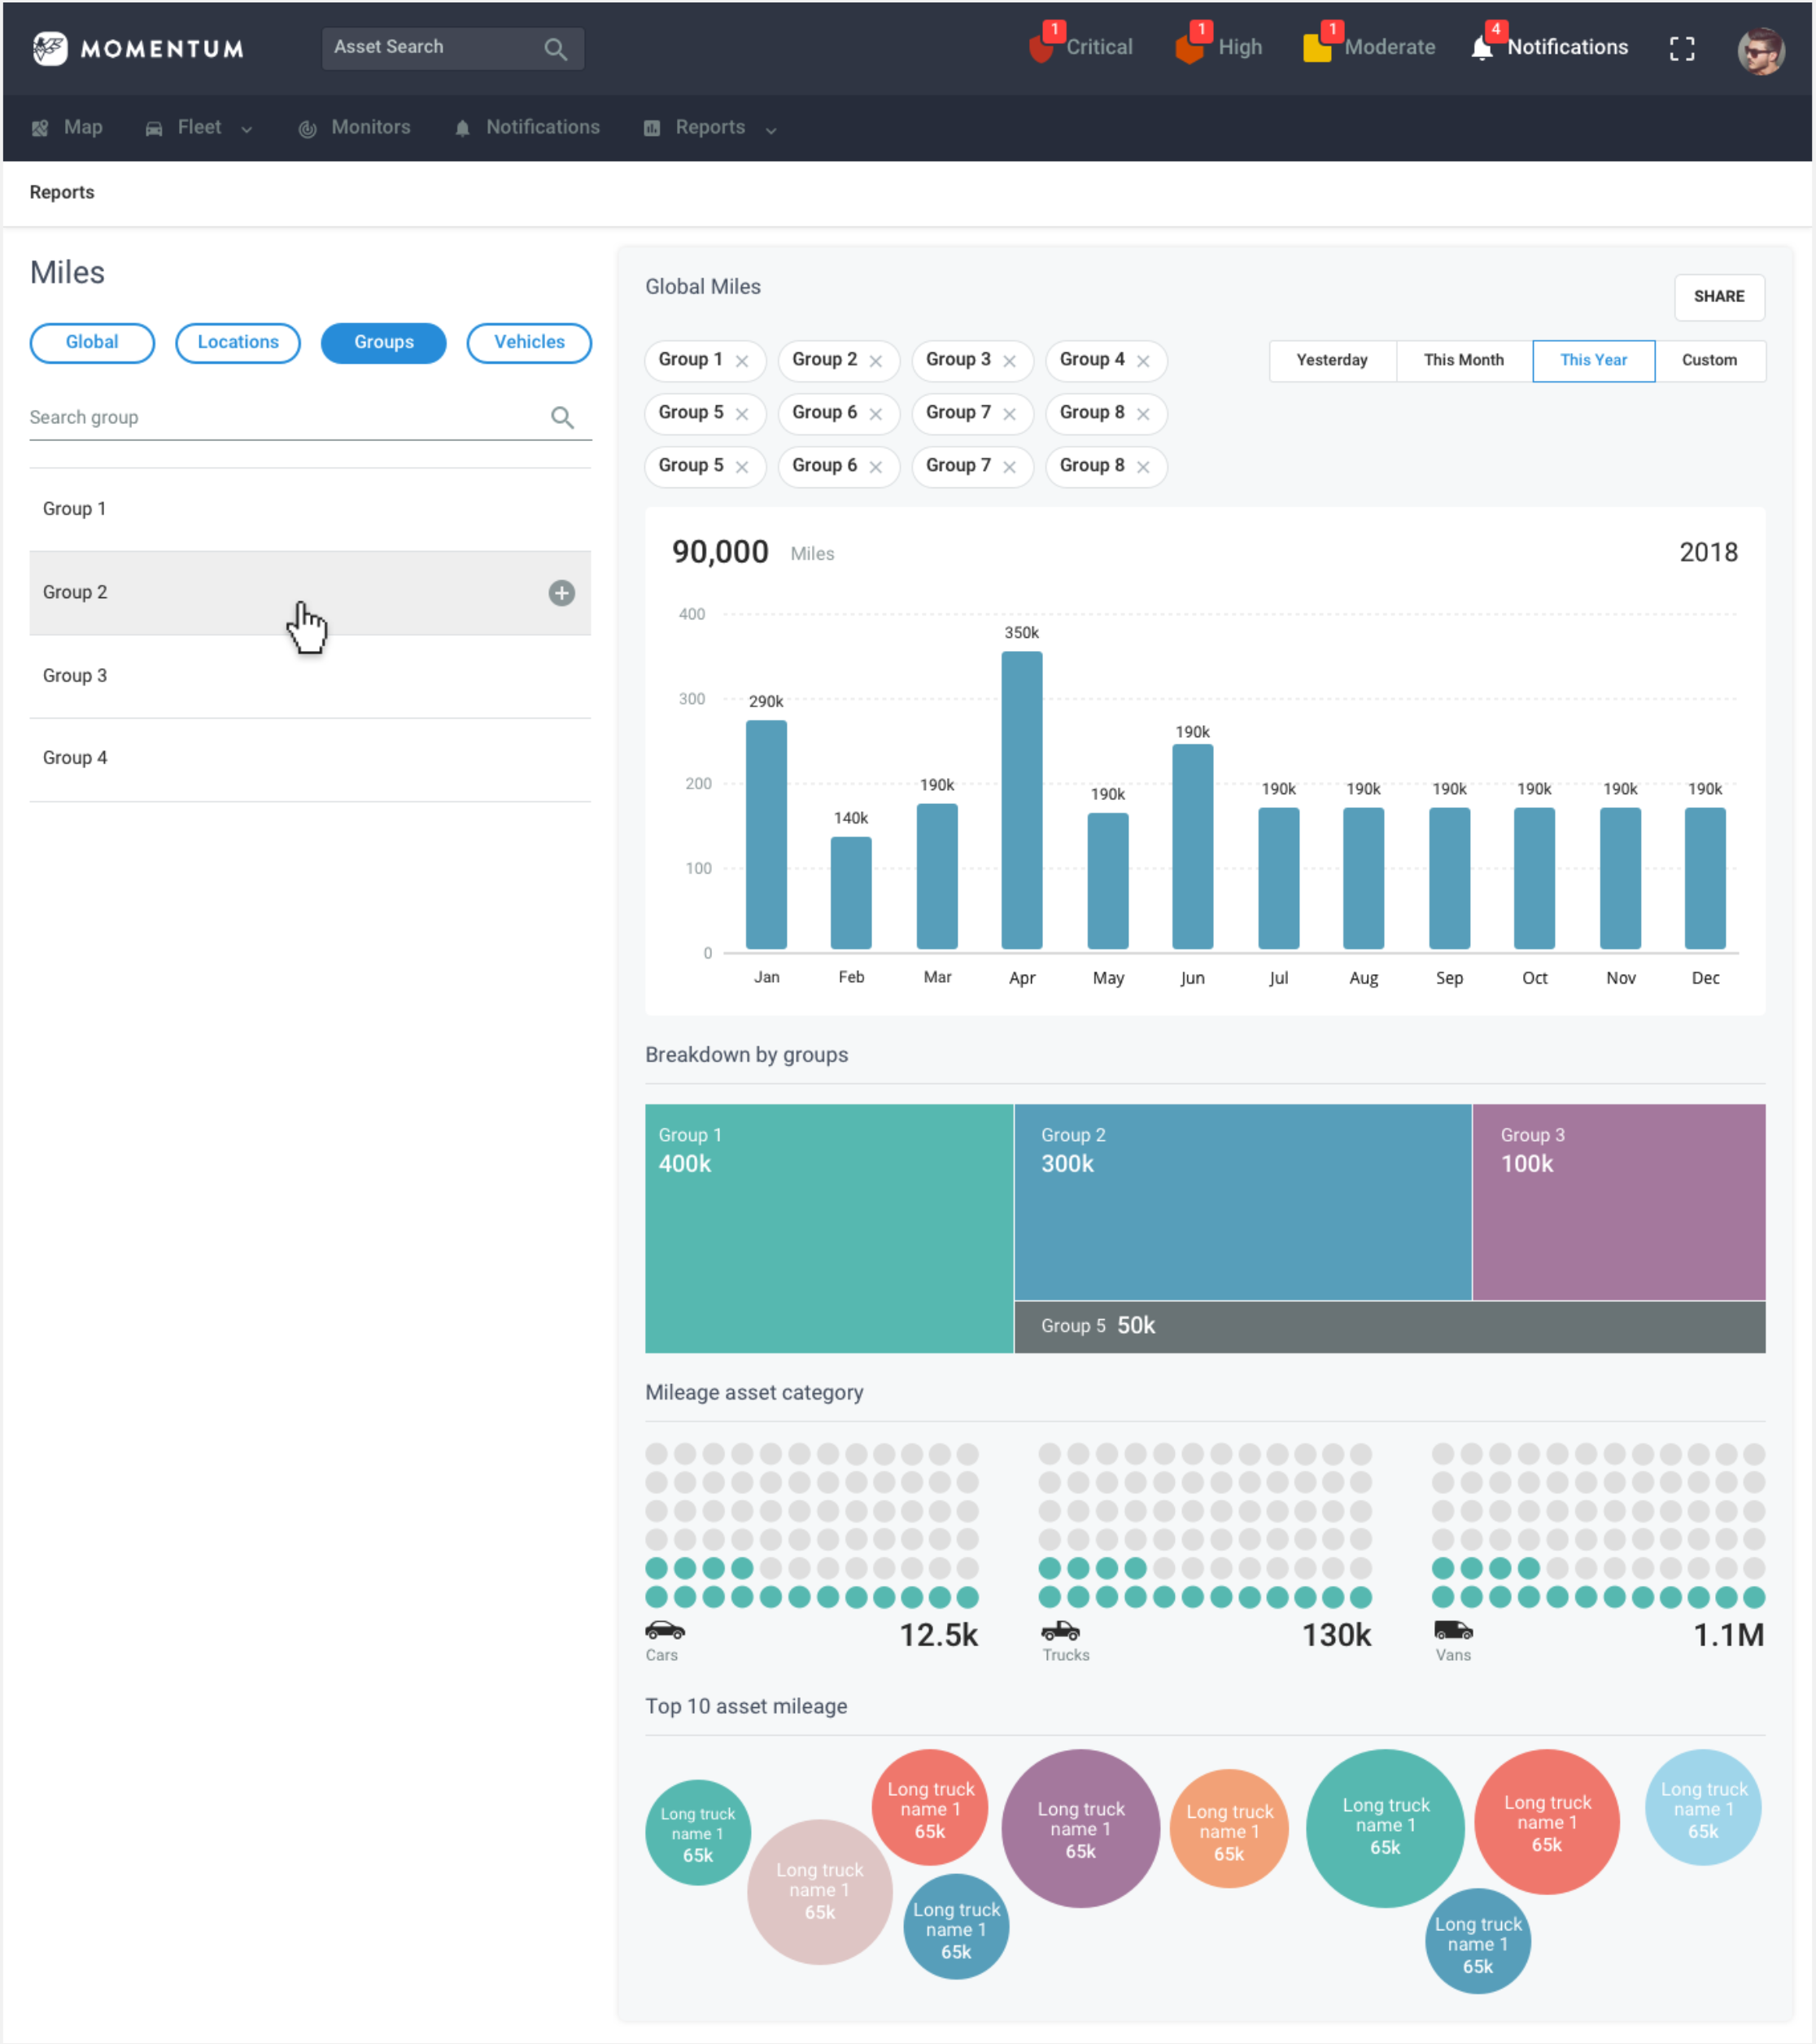
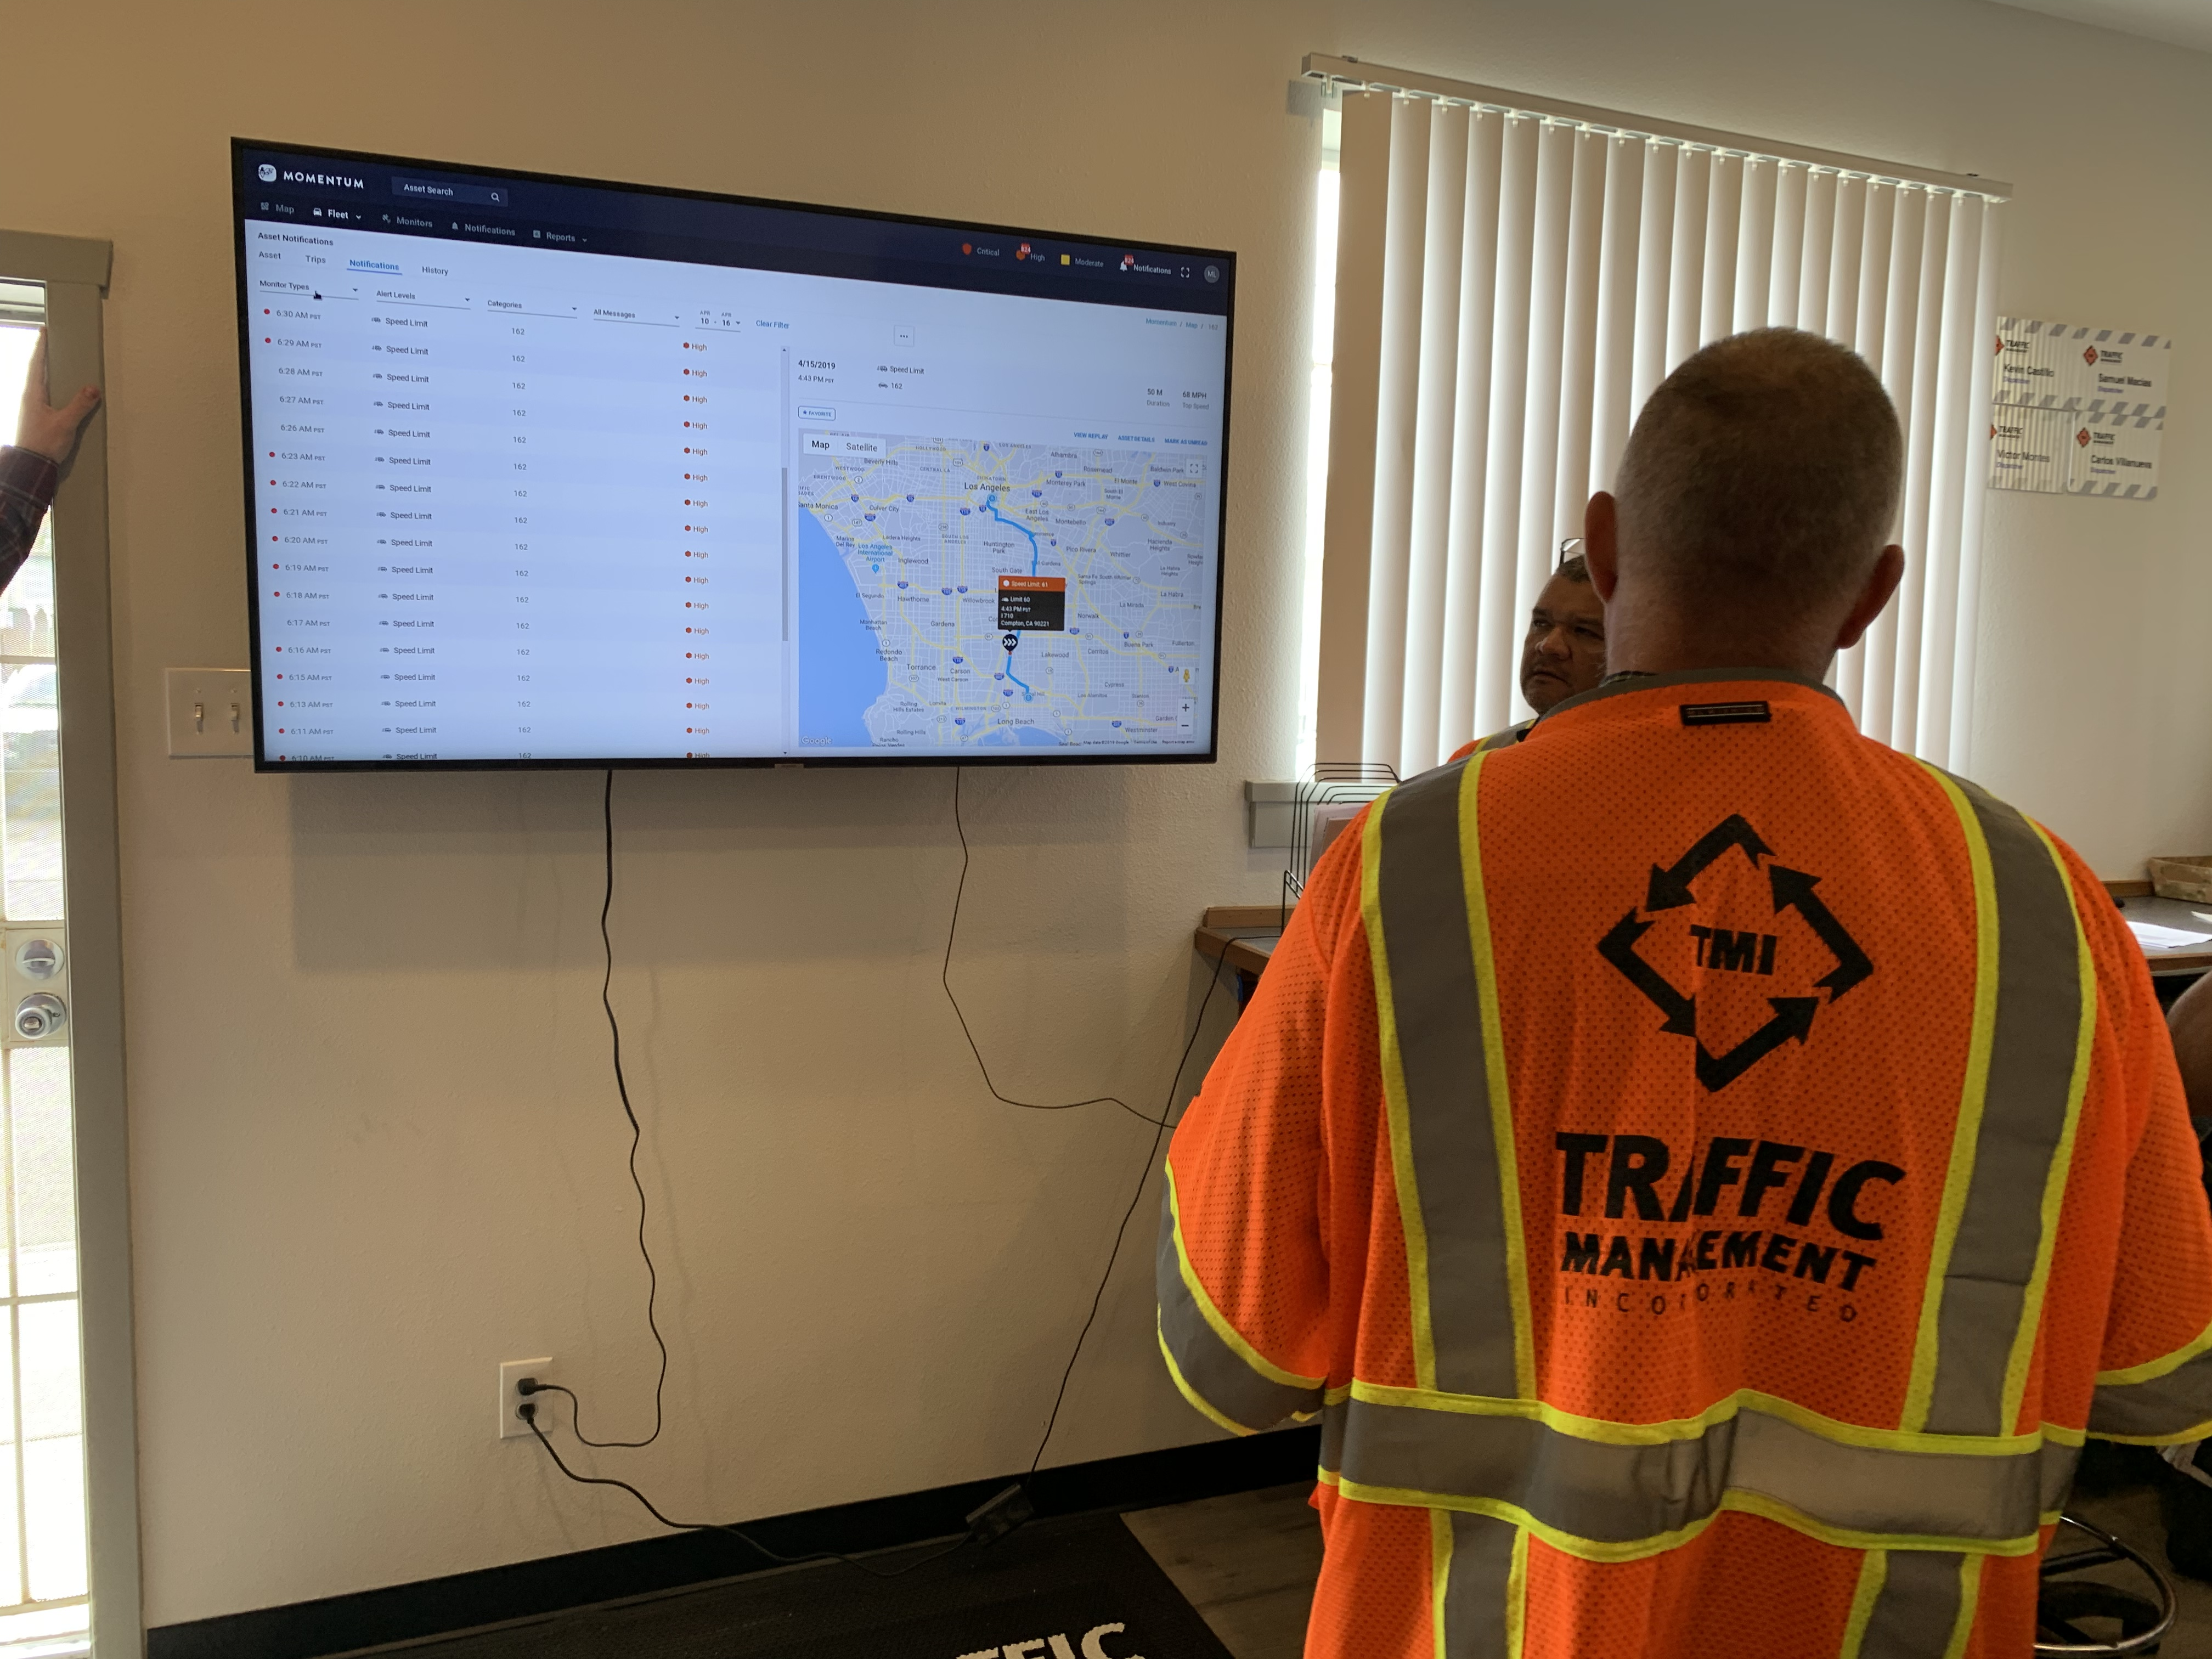
Tracked across industries, from first responders and plumbers to the City of Los Angeles.
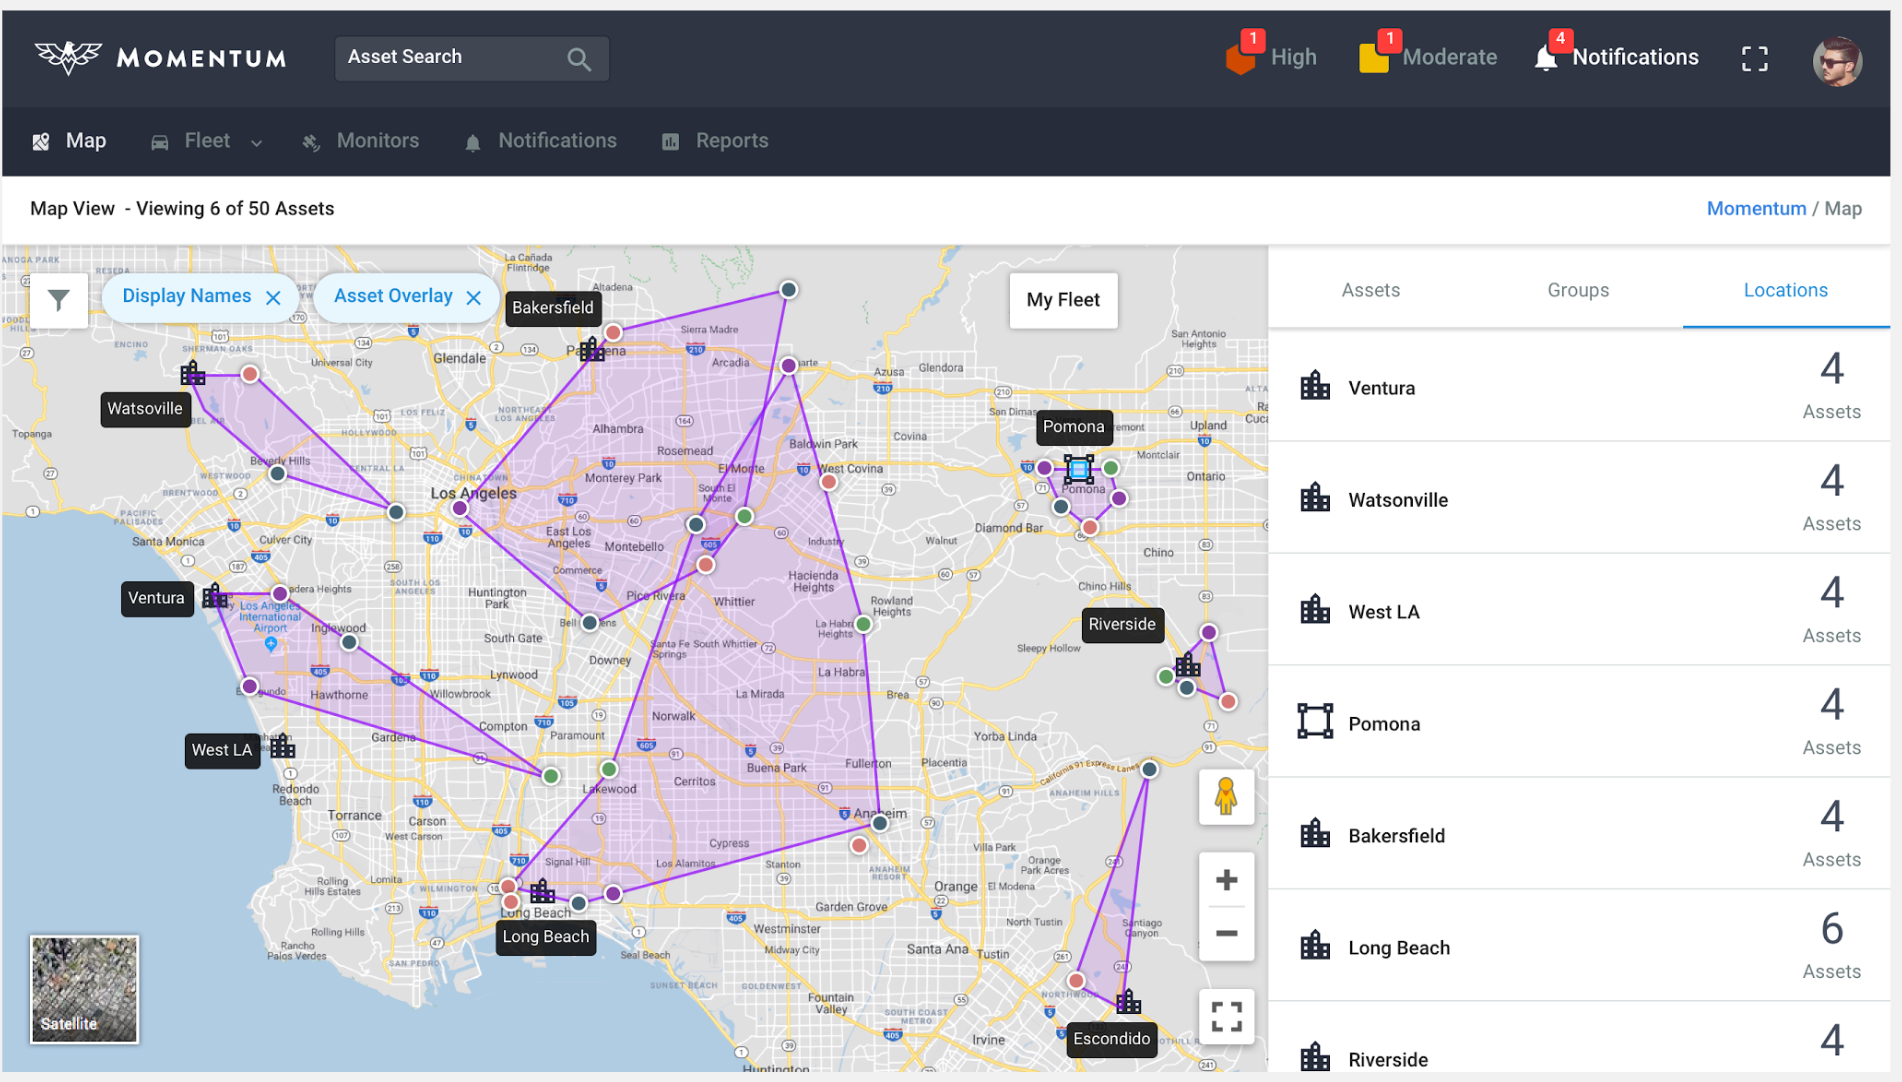
A shared asset view helped teams coordinate across locations and understand which assets were shared.
Customers cited the clean, easy-to-use interface as a reason for choosing Momentum over alternatives.
The founder had an MVP plan and a roadmap for the following year of hardware and software work.
Additional customers became design partners and participated in product testing.
Want to see how we got there?
Founding Product Designer
Fleet teams struggled to locate their assets, understand vehicle status, and coordinate across operating locations. Customer workshops revealed frustration with clunky dashboards and inaccurate information, alongside hesitation to trust another technology platform.
Product data and customer account records showed thousands of assets tracked across industries, from first responders to plumbers to the City of Los Angeles.
Read the results and customer feedback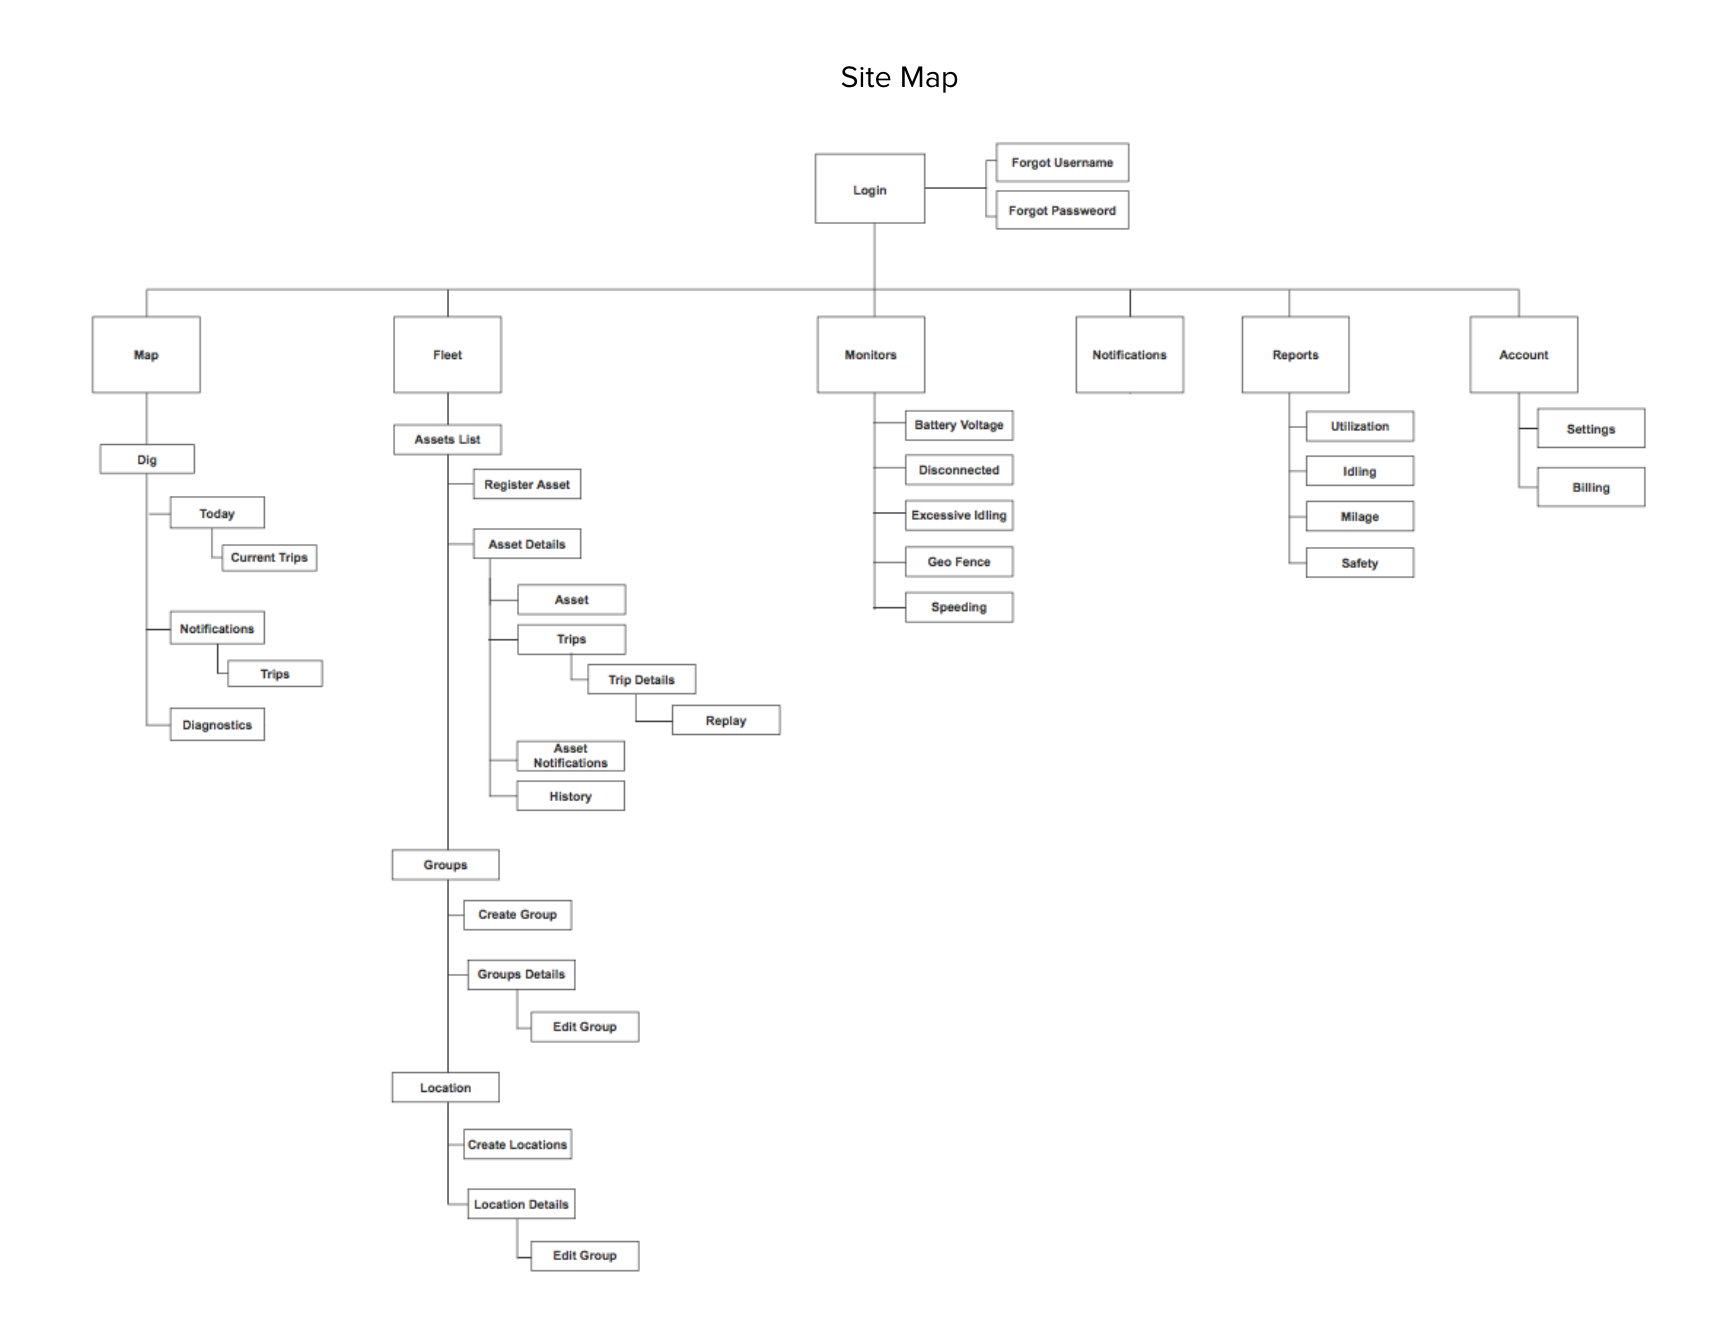
I built a 0 to 1 fleet management SaaS product as the first hire. My role was to speak with customers from a variety of industries and design a product for this space.
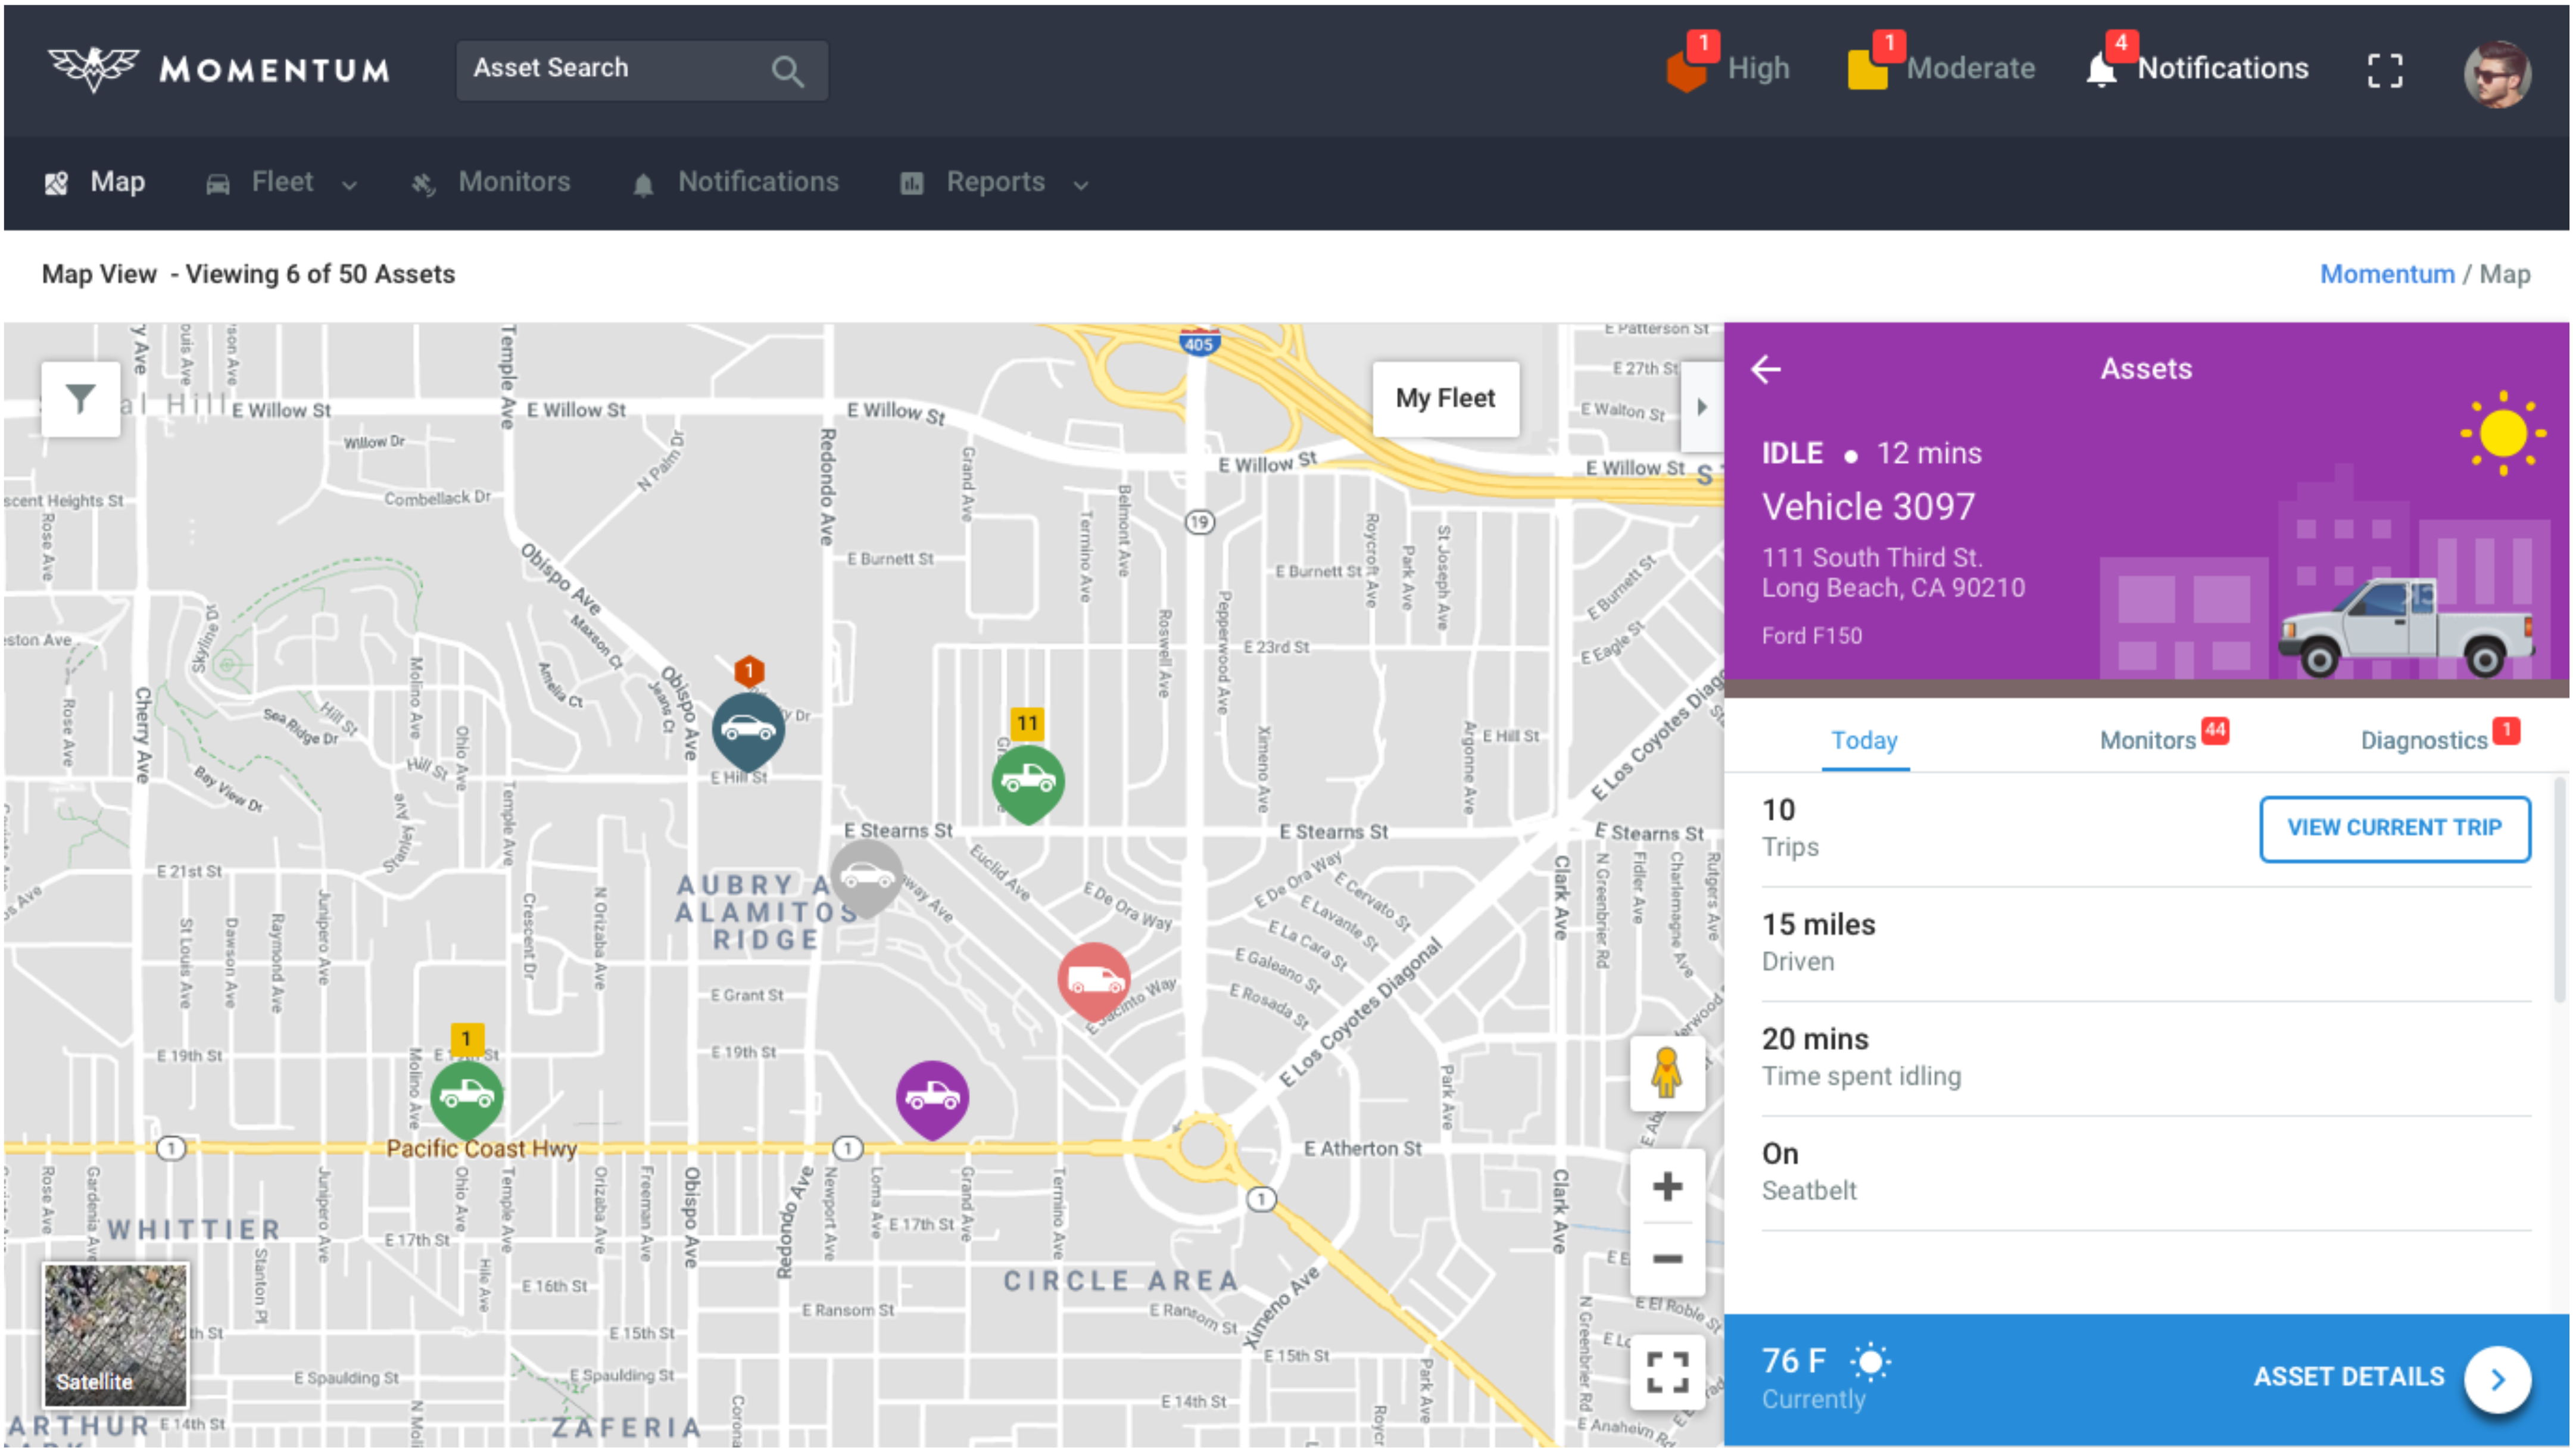
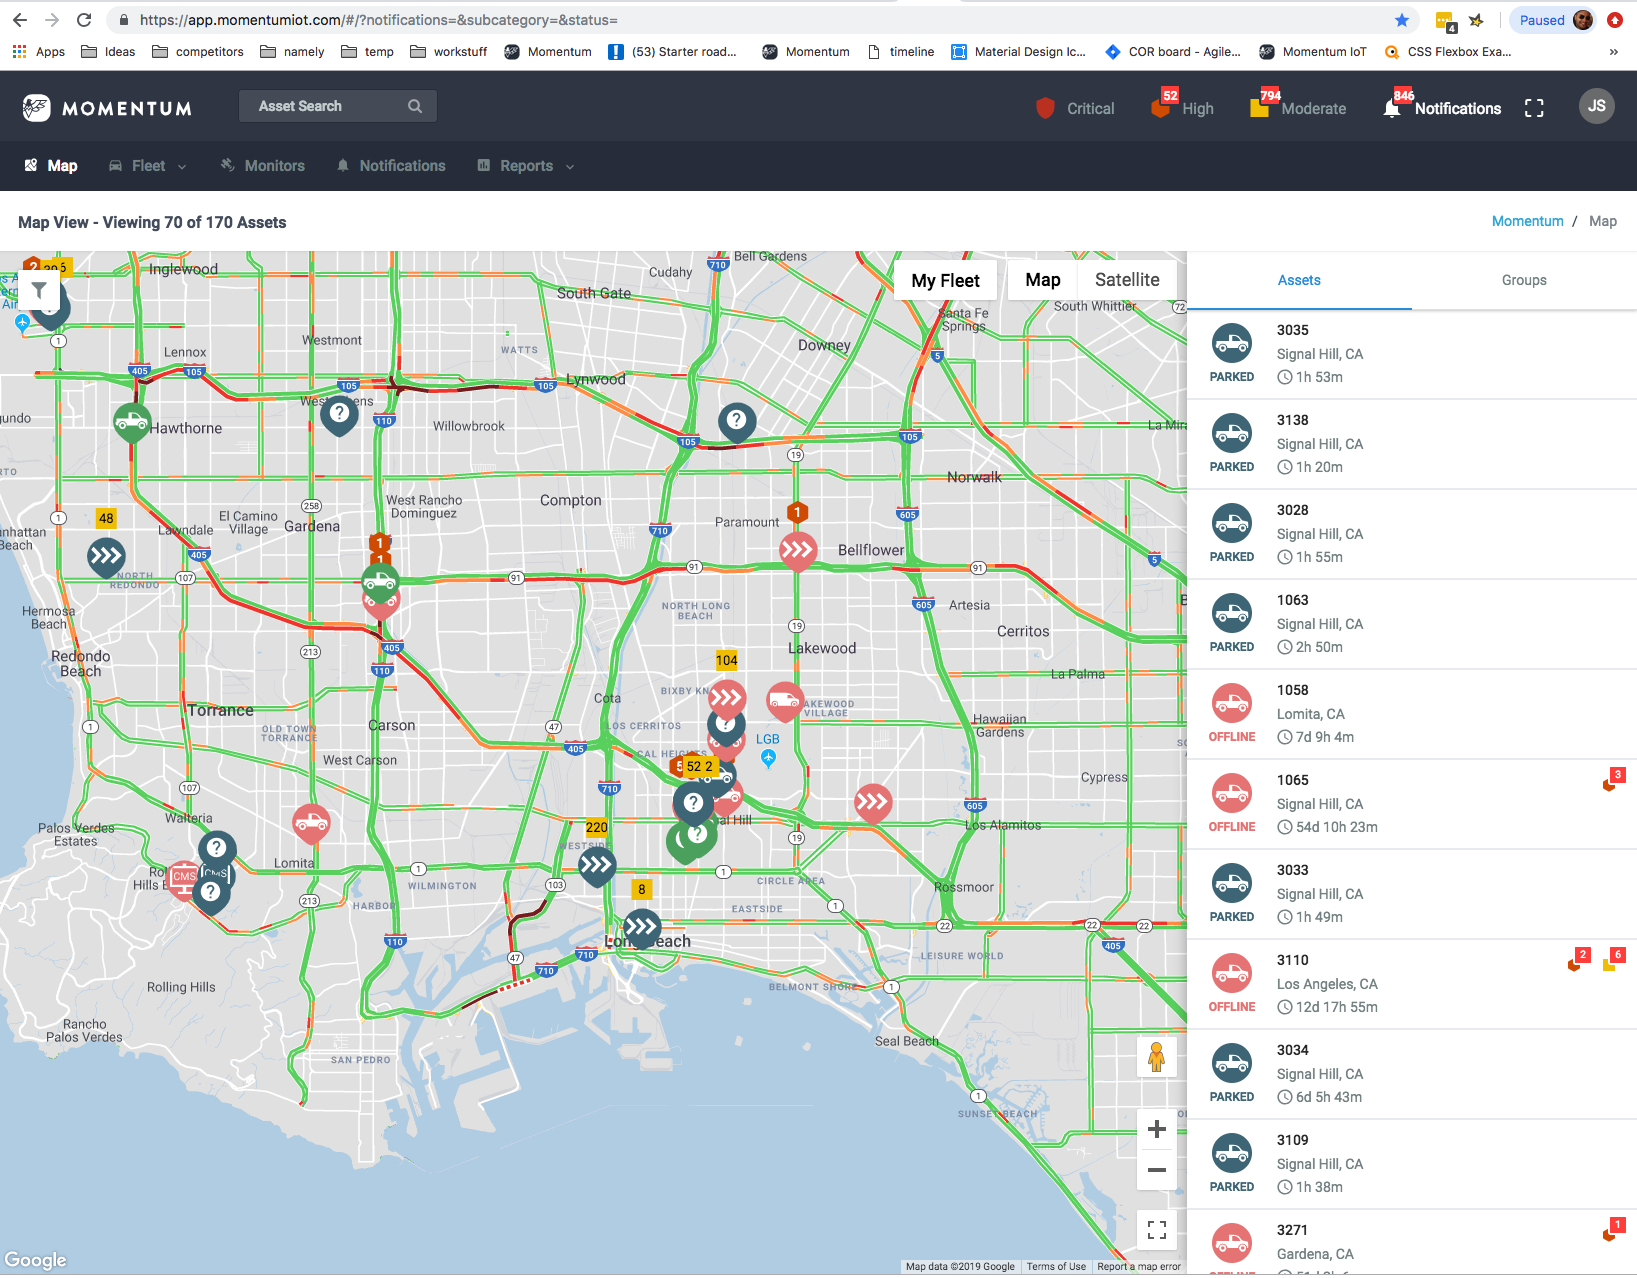
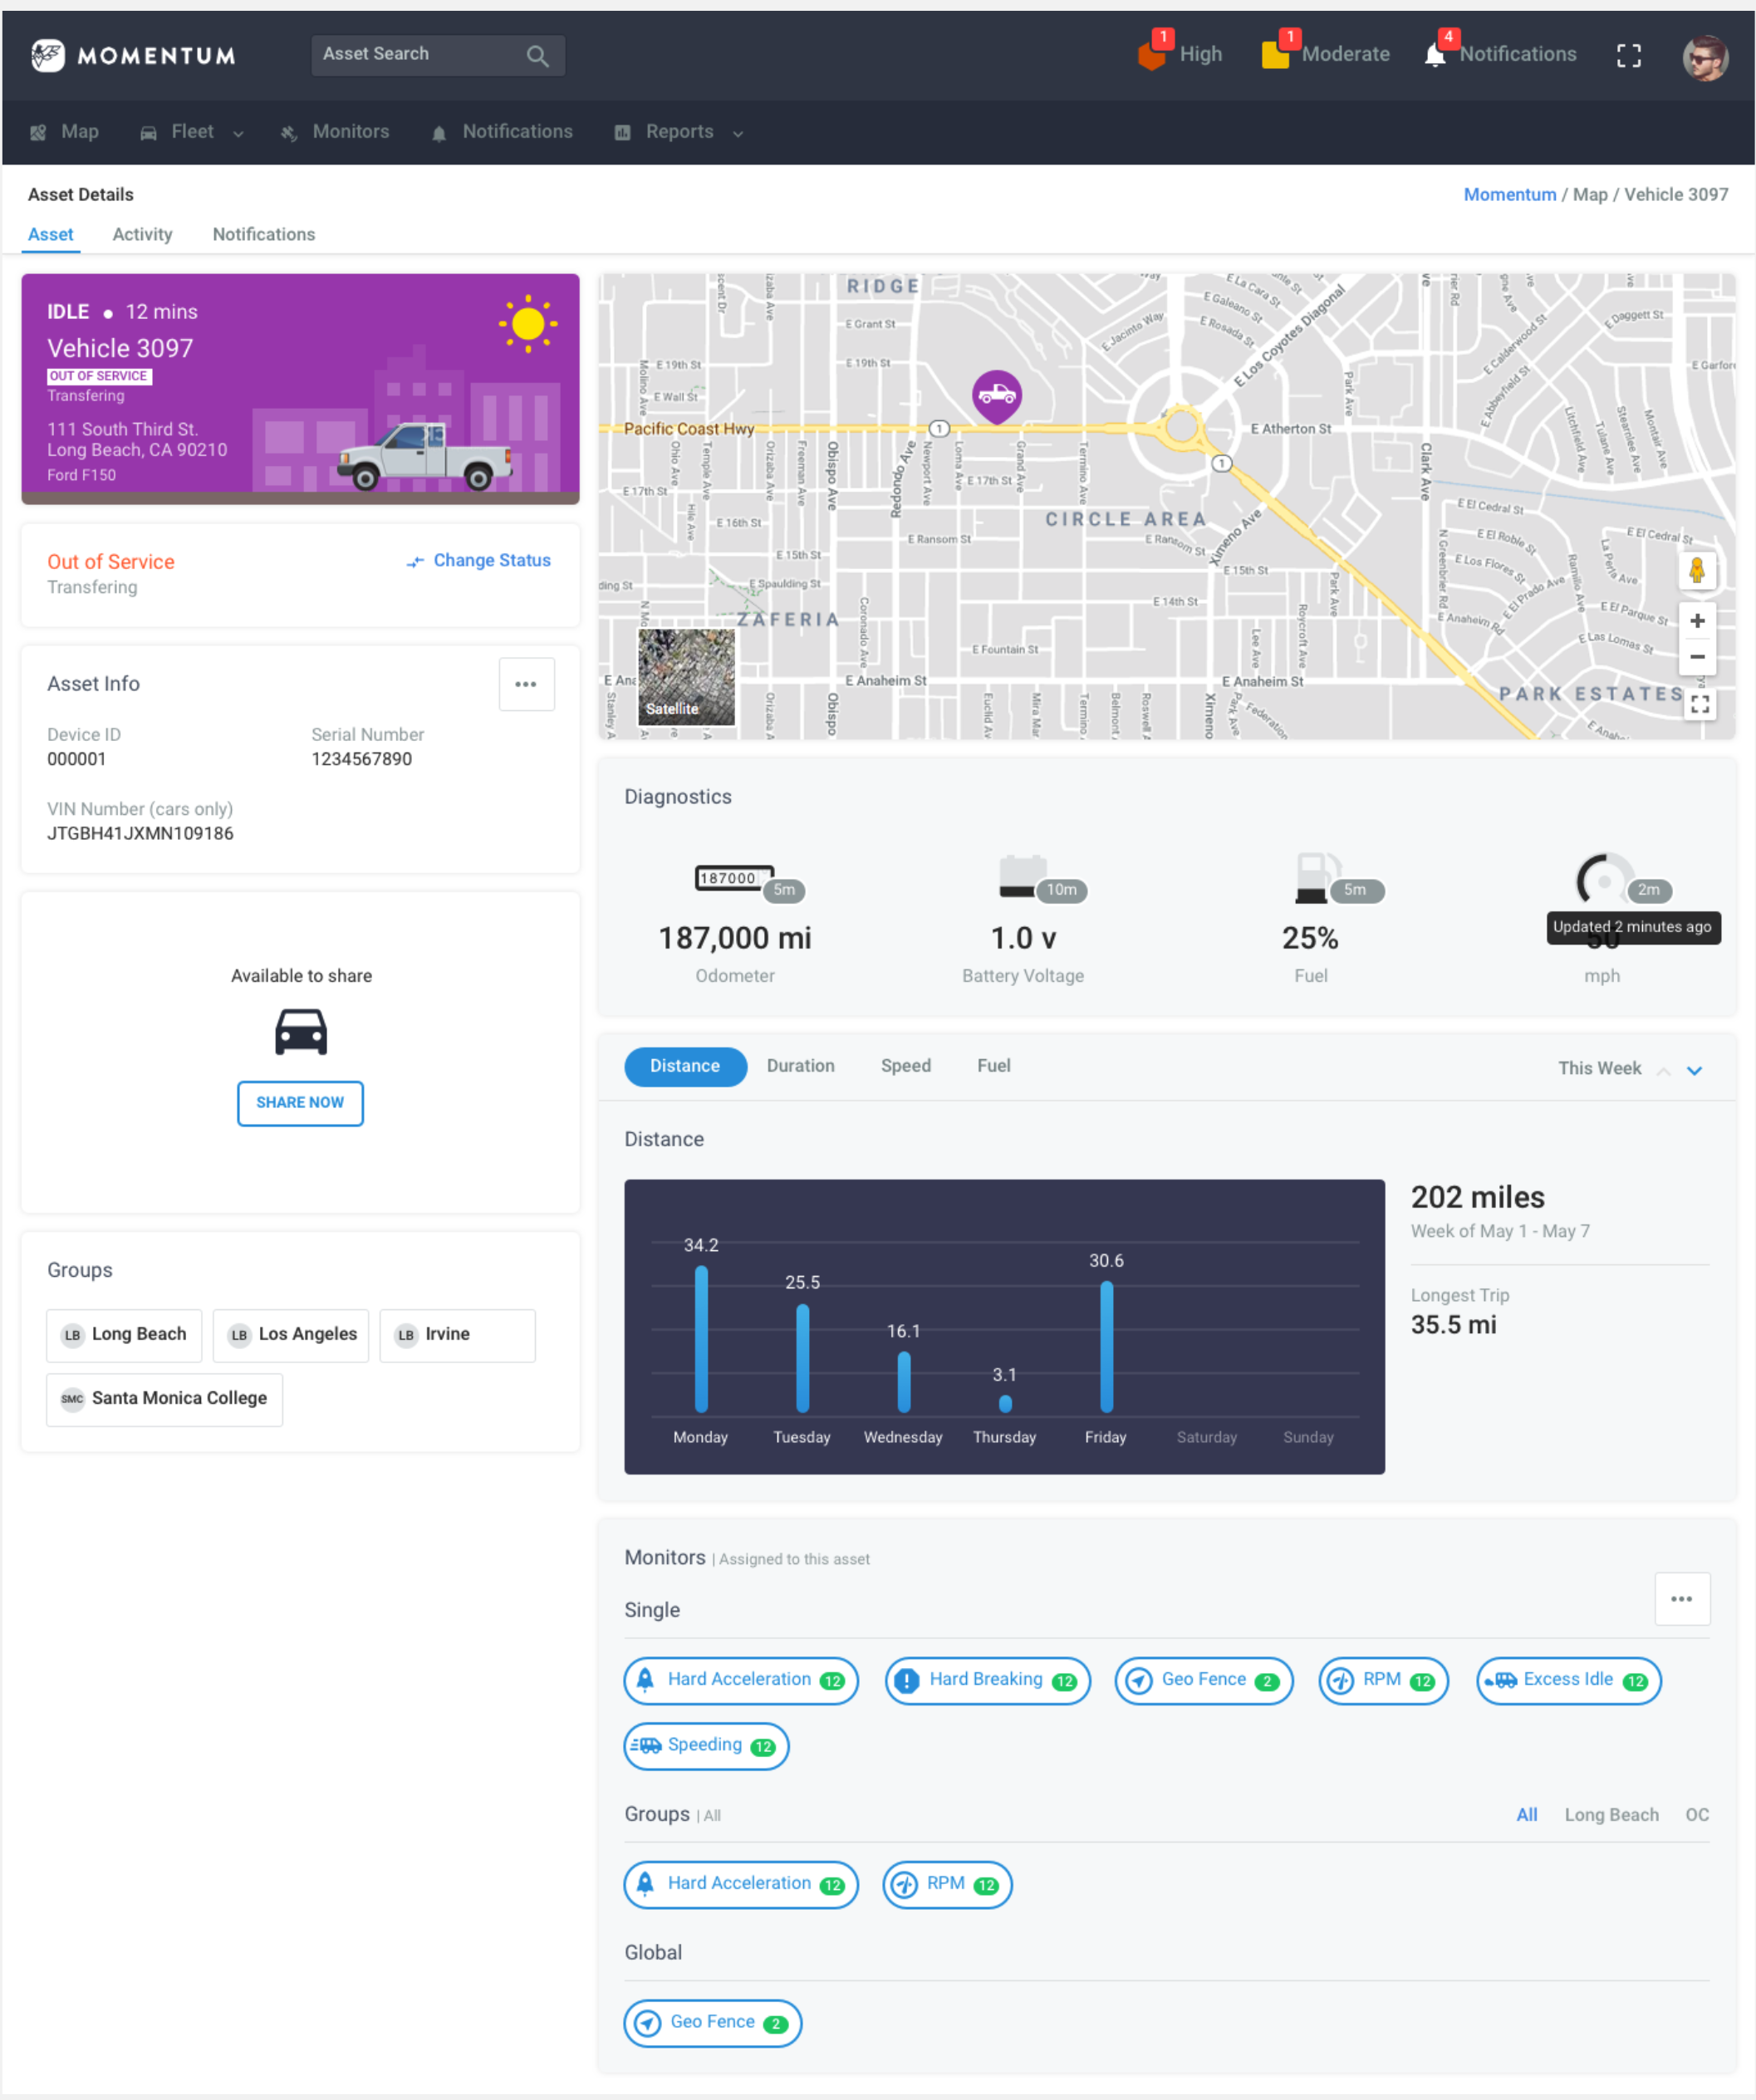
I designed a fleet-management experience connecting tracking hardware with desktop and mobile apps. Working with my team, I helped fleet managers track assets on a live map, monitor vehicle health, understand driver behavior and safety, and assign assets to the right locations.
Fleet teams struggled to locate their assets, understand vehicle status, and coordinate across operating locations. Customer workshops revealed frustration with clunky dashboards and inaccurate information, alongside hesitation to trust another technology platform.
Fleets range from 100 to 5,000 assets across a variety of industries, transportation, construction, entertainment, and more, and the existing tools weren’t built for how these teams actually work.
I led fleet managers from transportation, construction, and entertainment in a design thinking workshop.
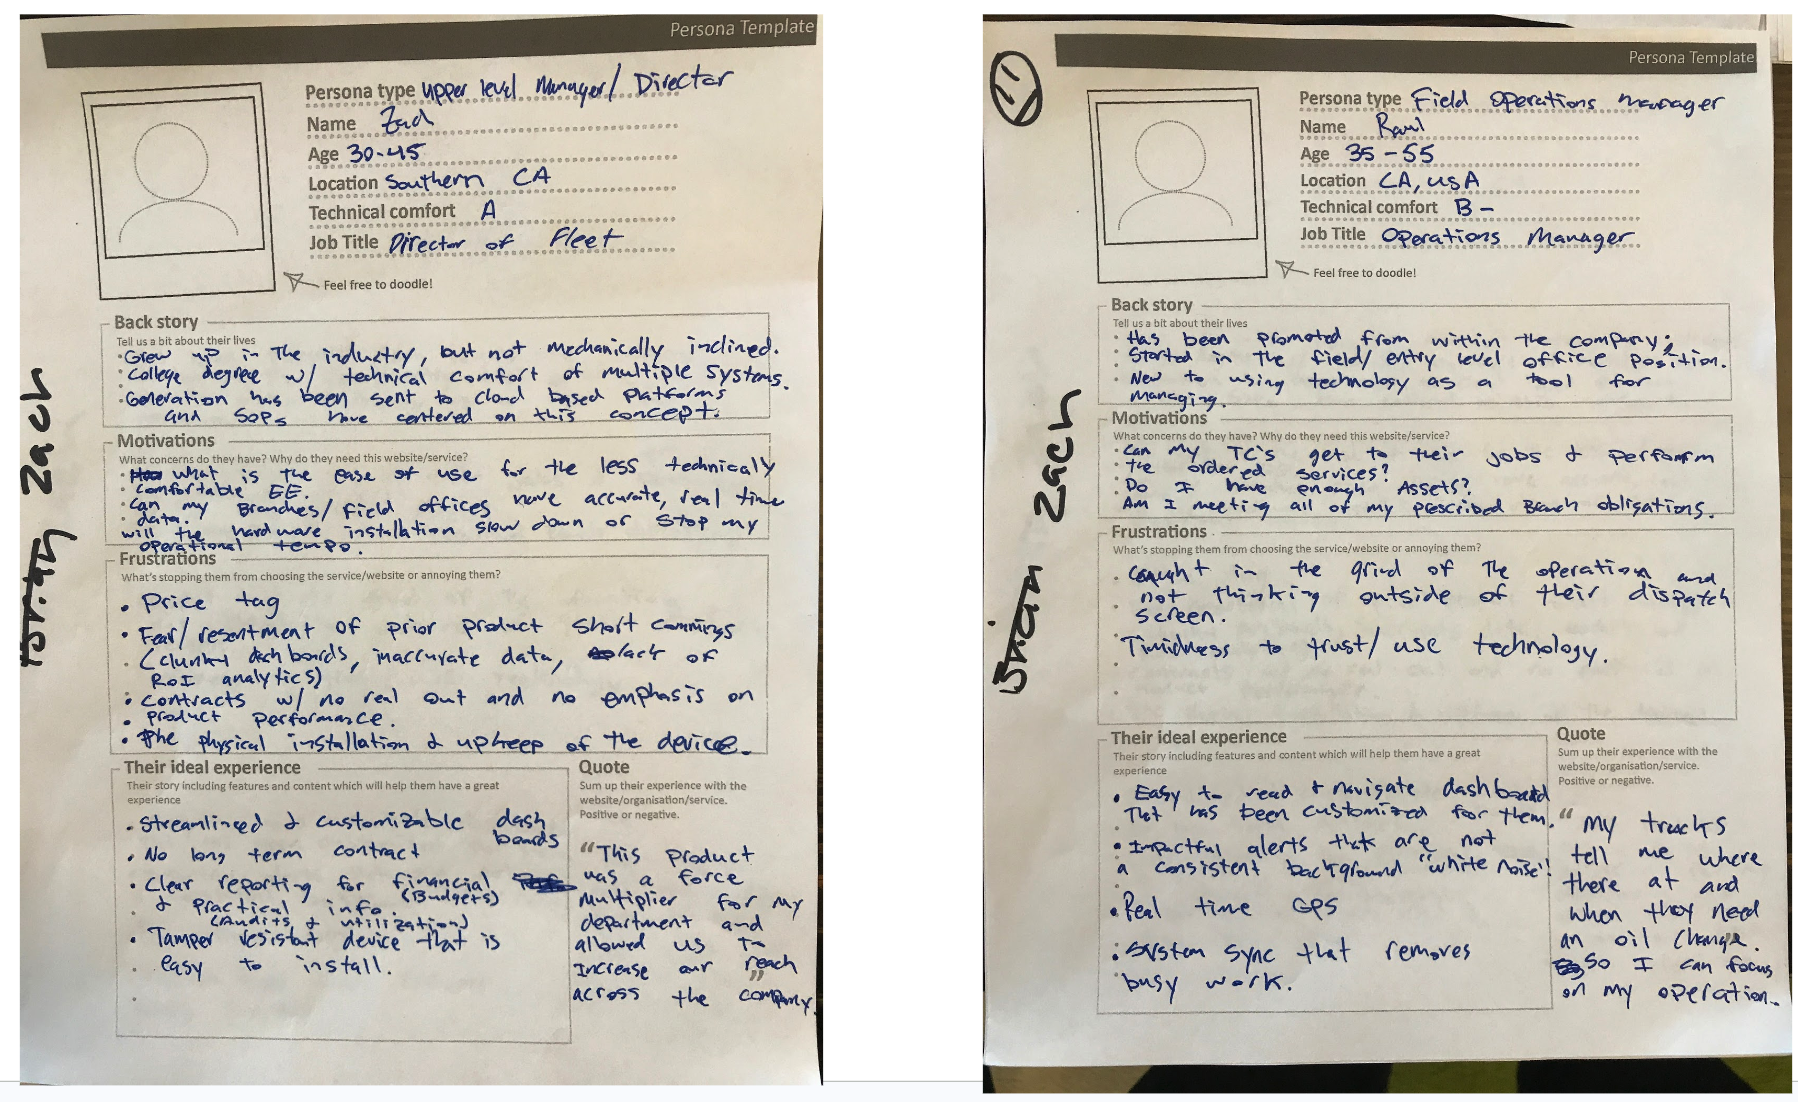
What the personas revealed: fleet directors needed accurate, real-time information across field offices and simpler dashboards for less technical colleagues. Field operations managers needed to know whether they had the right assets for the work, with useful alerts and less administrative effort. These needs grounded the product in location, status, and coordination.
I had design partners create their own personas so we could better understand their goals and frustrations around managing fleets. This helped us with the stories we created and sketched.
We agreed to build the product around two goals. If at any point we diverged, I always brought the group back to these to keep us on track.
We then created stories using our personas to understand real-world scenarios. One story that stood out was how they kept losing bulldozers.
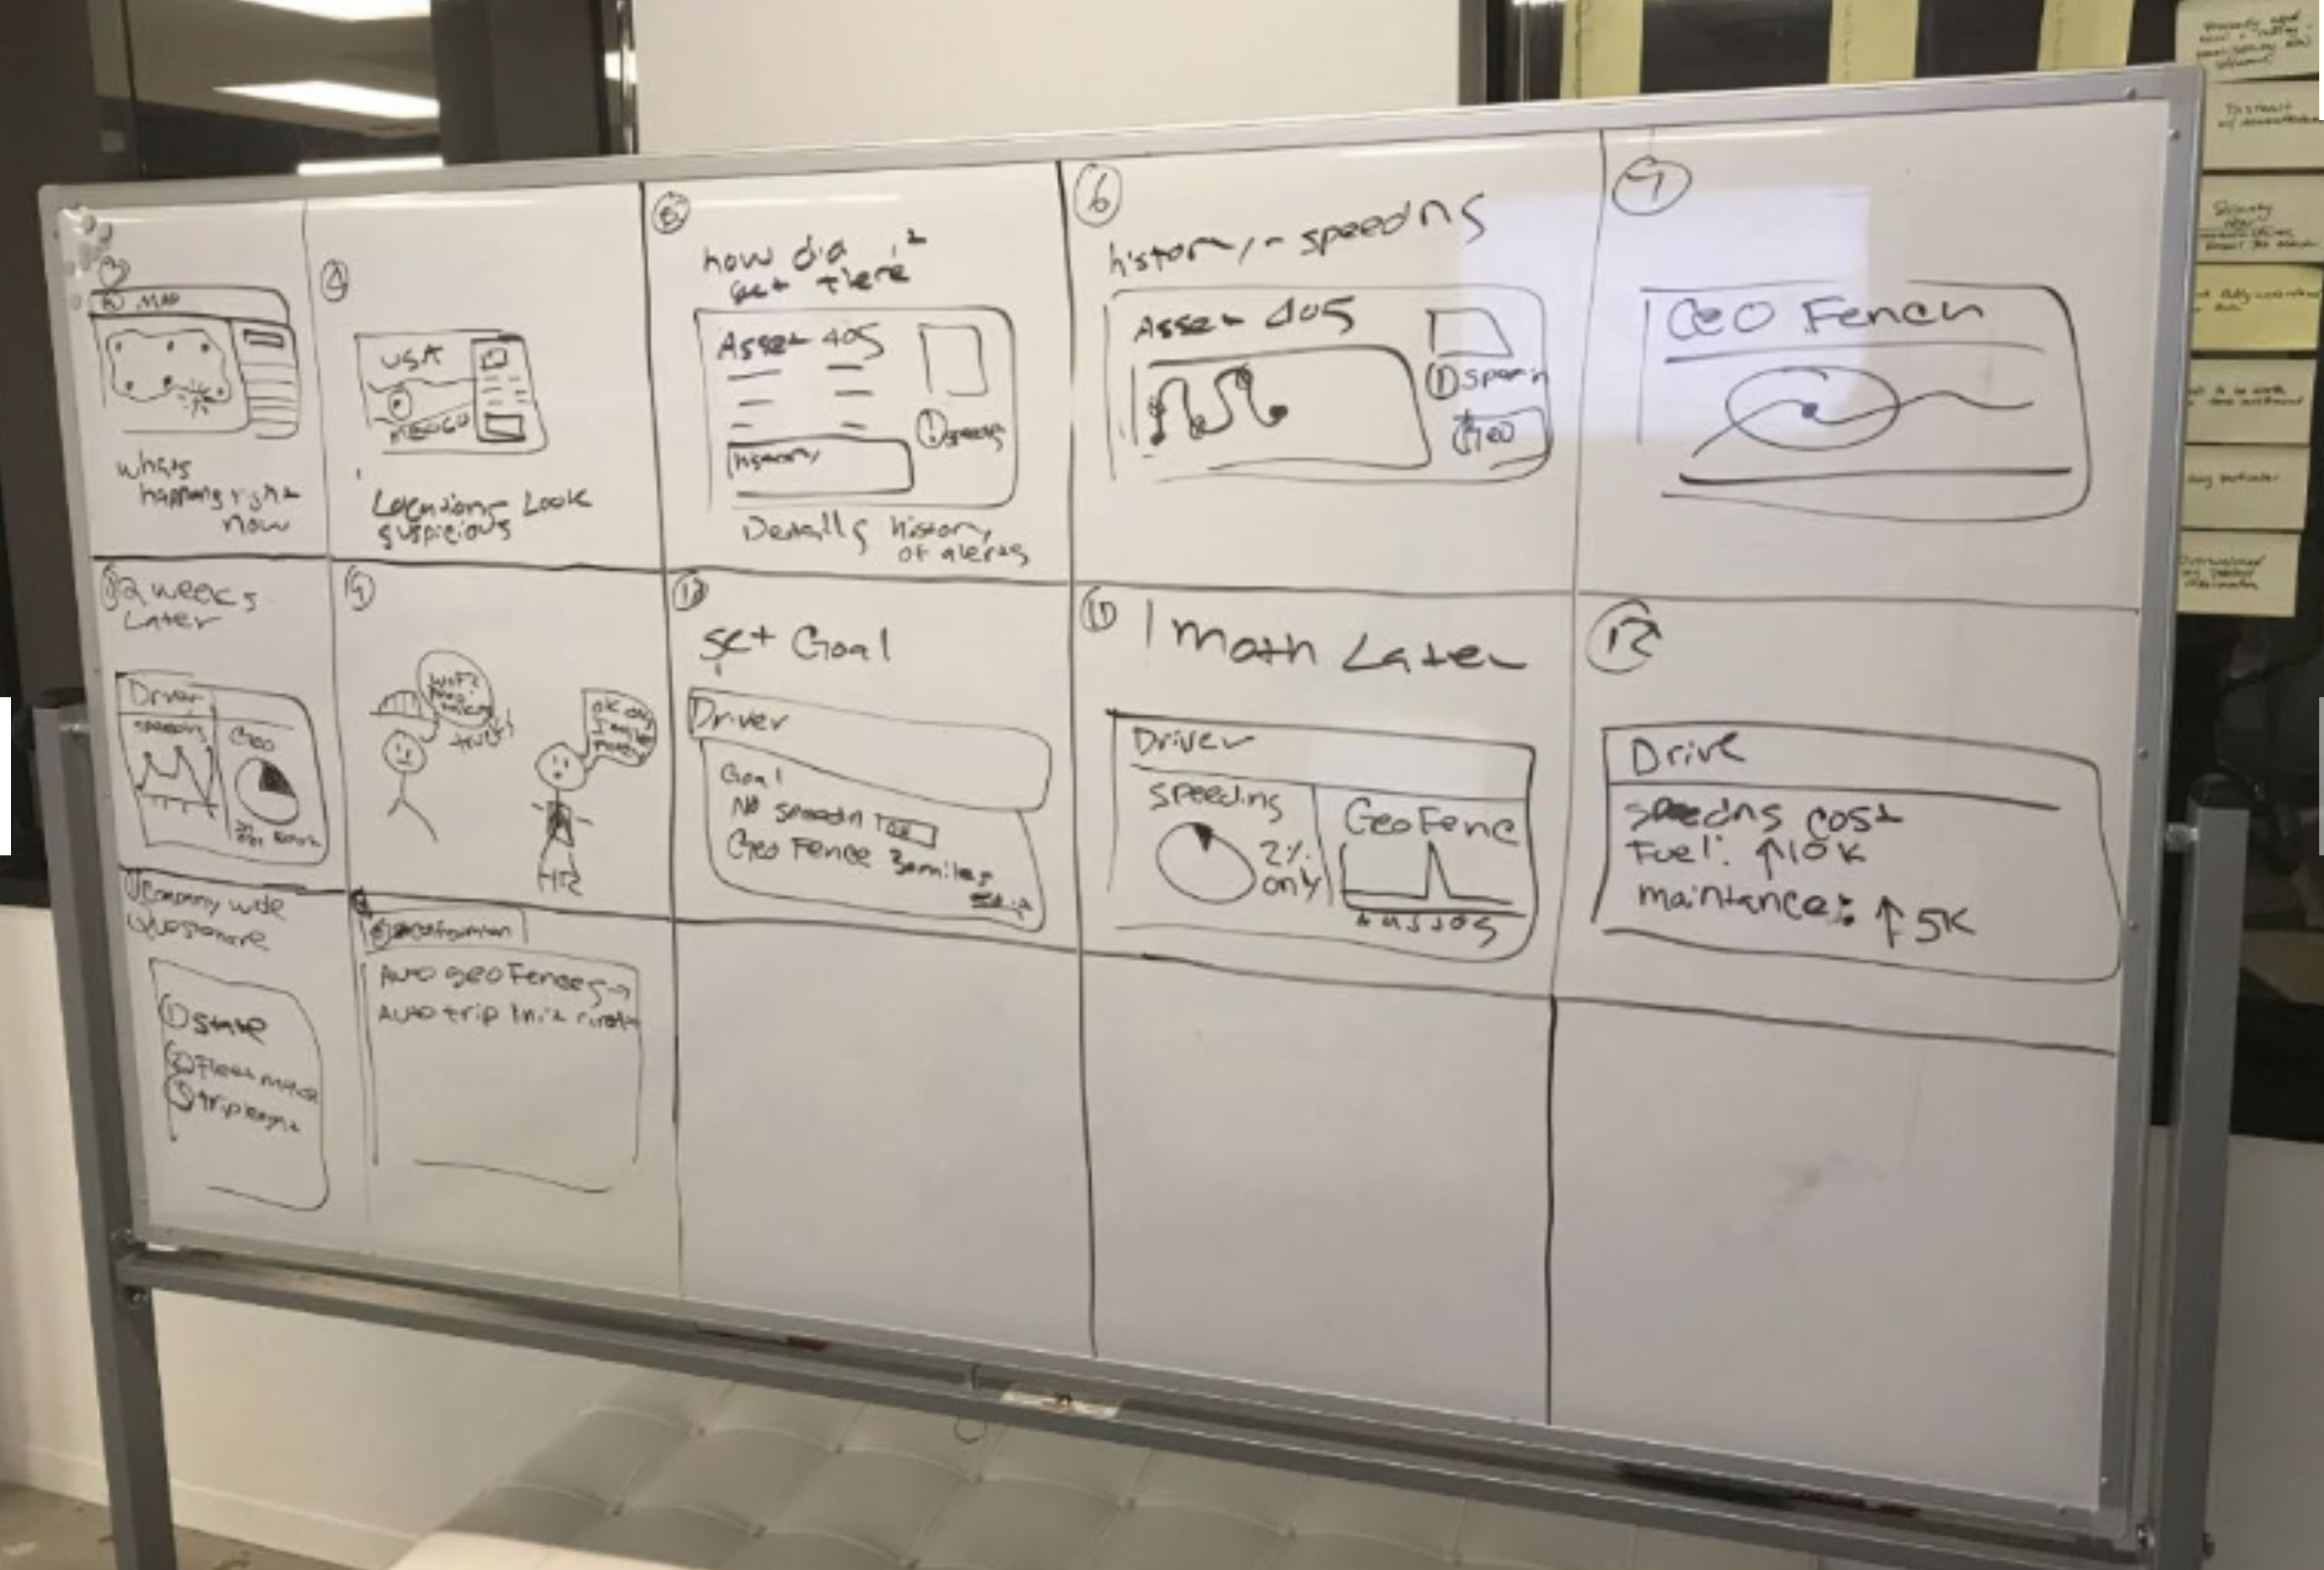
We now had stories to sketch, and I asked everyone to draw their ideal product. It was interesting how they all drew the same solution. My founder was shocked. Happy, but shocked.
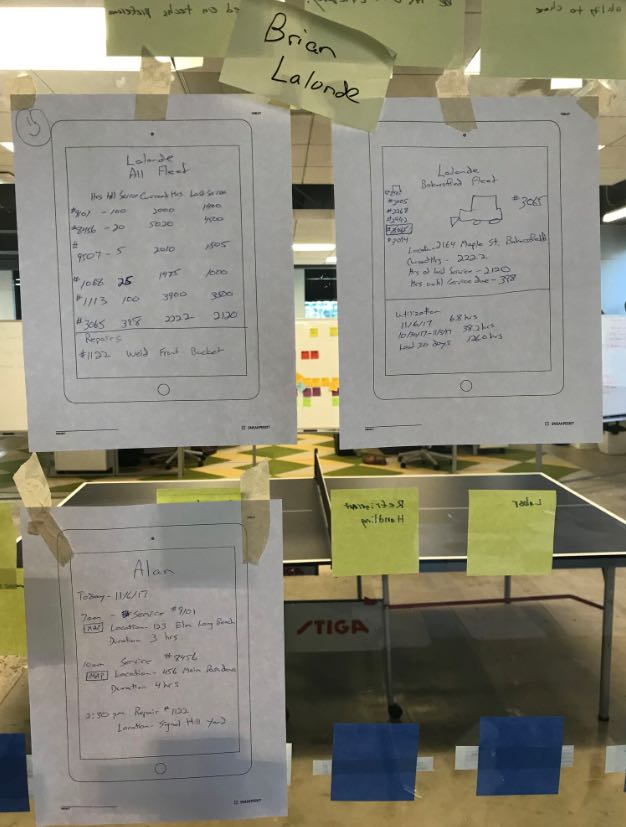
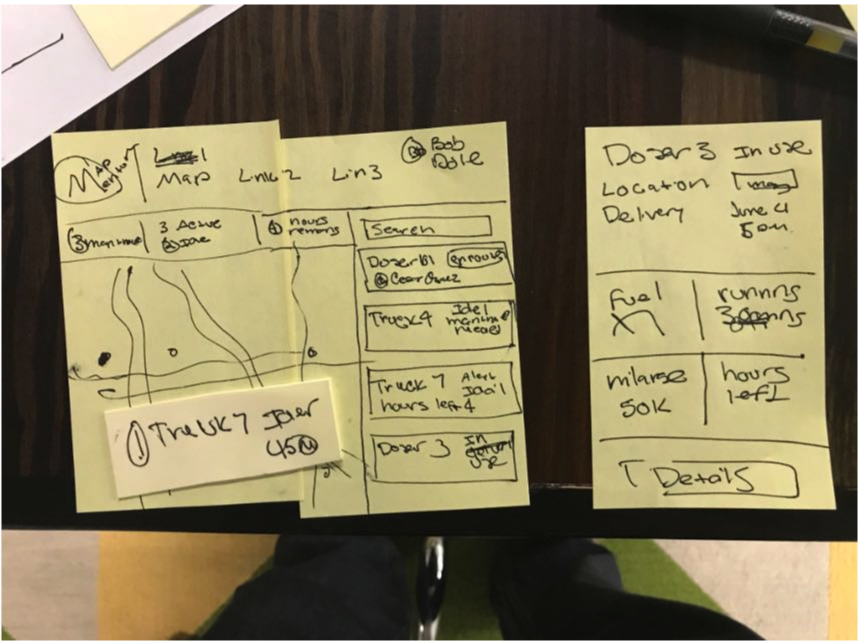
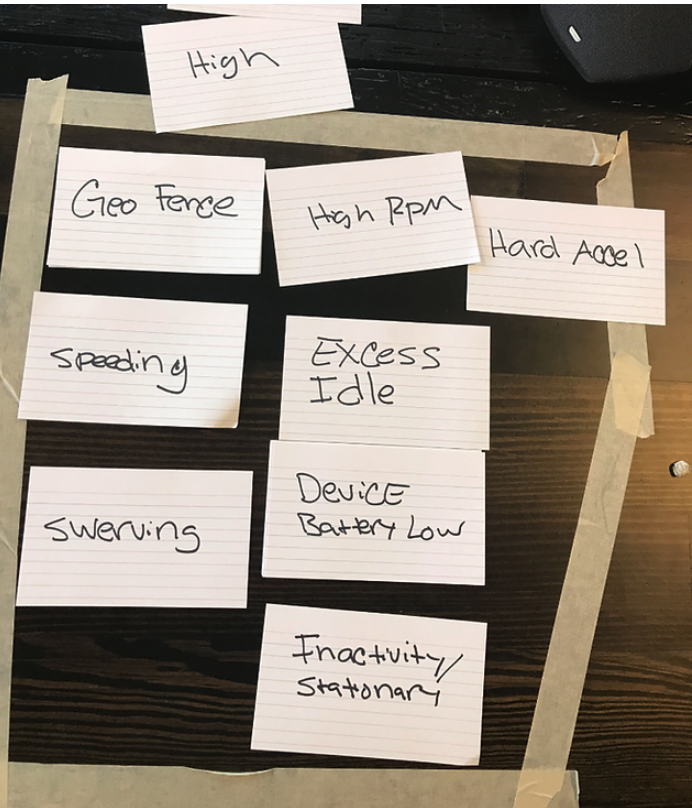
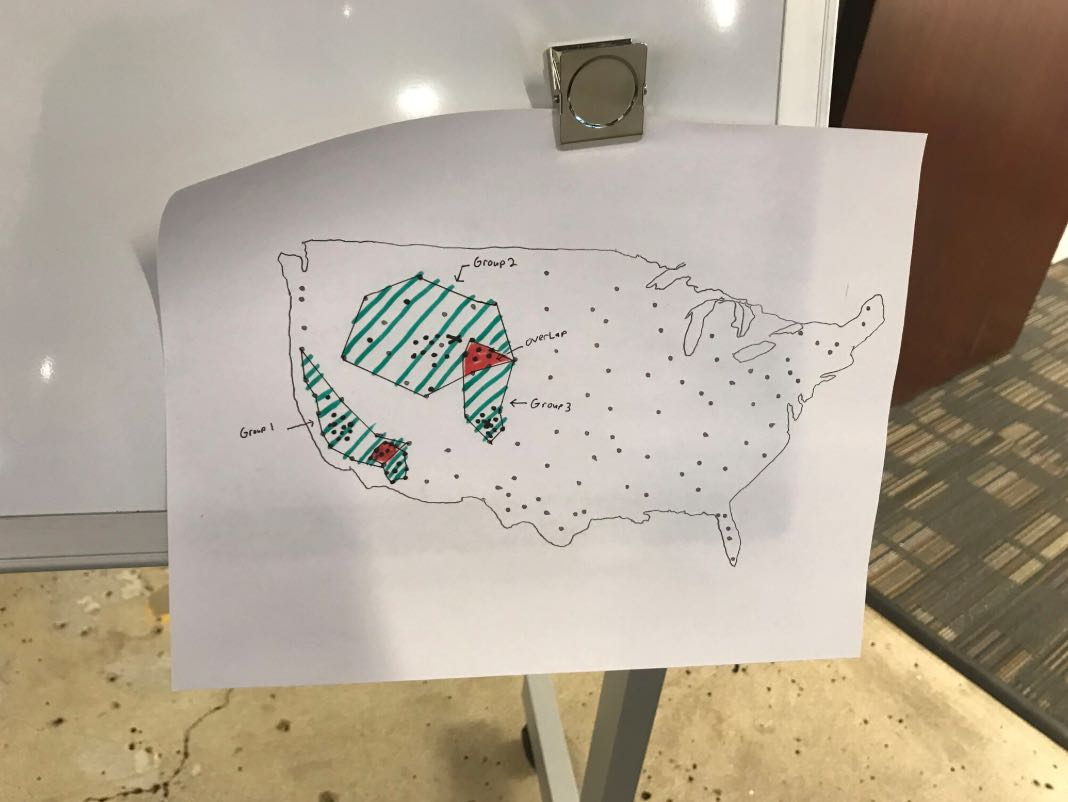
Customers wanted specific fleets highlighted to prevent vehicles from different garages crossing over one another.
From sitemaps and user flows to wireframes, prototypes, and the shipped product.
Working incrementally in our agile process helped my internal team stay aligned on scope, MVP first, then the fuller experience.
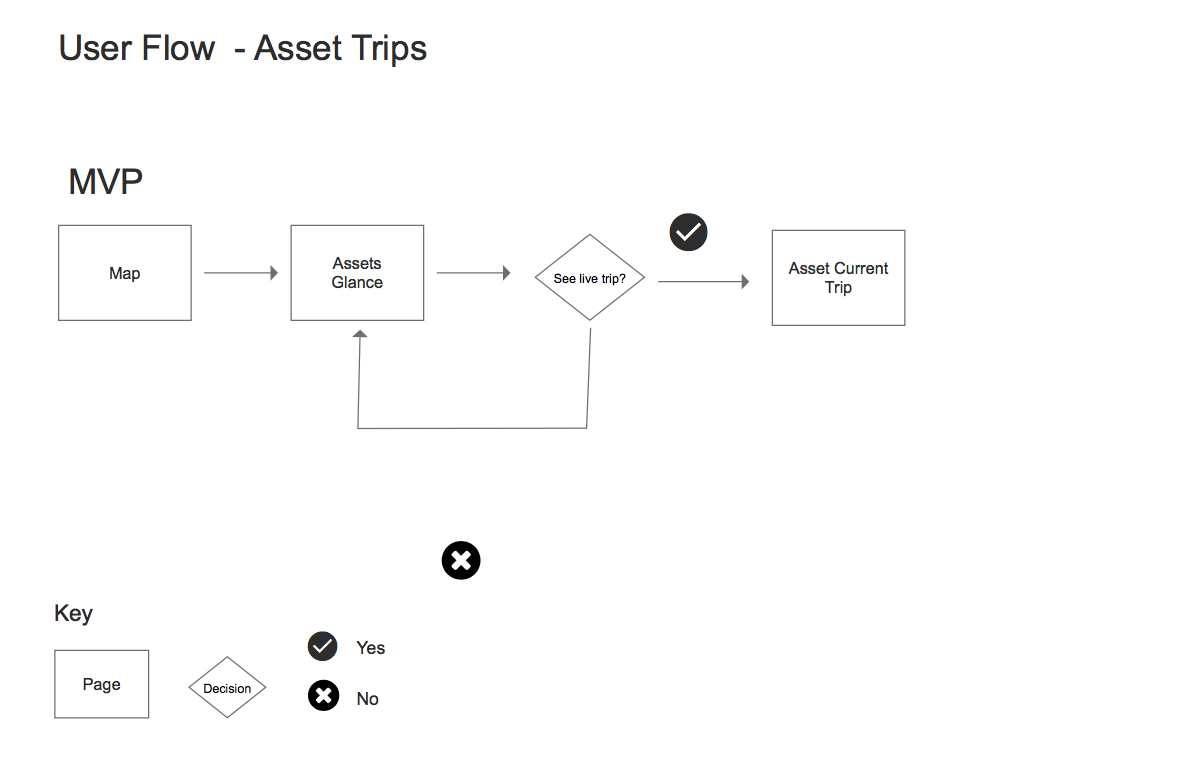
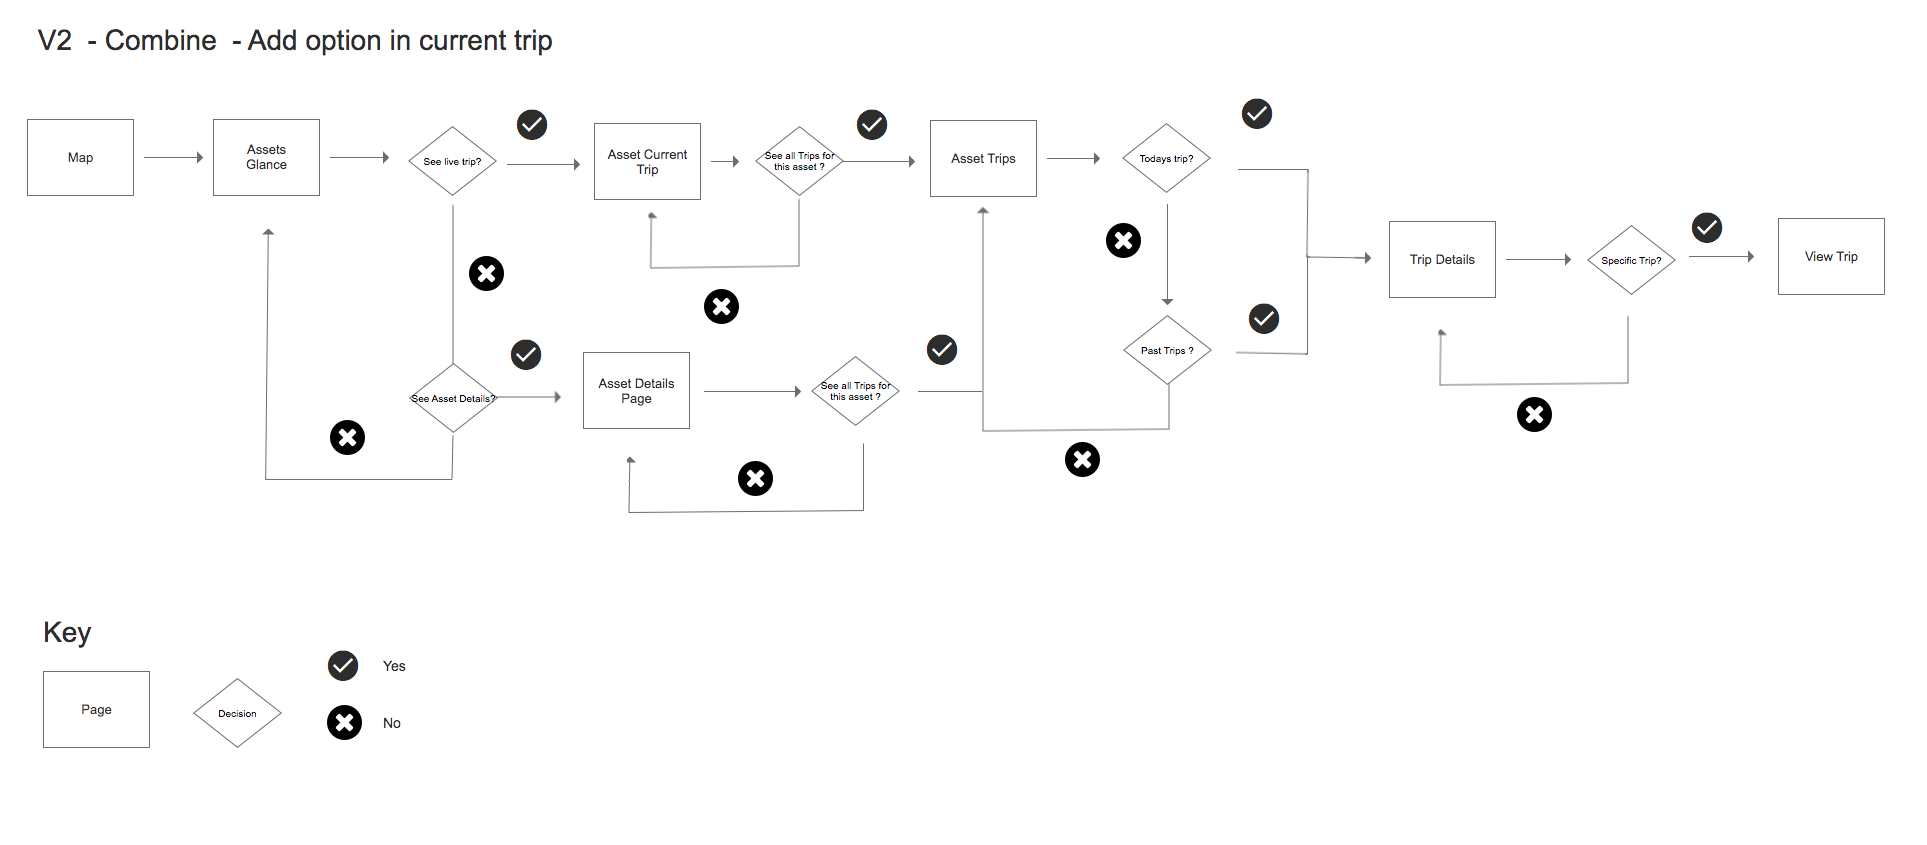
We iterated with users and stakeholders to ensure the content made sense to all. Thanks to the wireframes, and by working with hardware and software engineering, we discovered tech and hardware constraints such as Google Maps limitations and false fuel-tank information. I prototyped in Axure, which enabled us to test quick and often, leading to improvements to the application. I then used Figma to design the product.
The founder wanted customers to see how much fuel a vehicle had, but engineering could not reliably provide gallons across vehicles with different gauges. I researched the constraint and proposed showing fuel as a percentage instead. That gave customers a relative fuel level without implying a precise gallon reading. The founder and engineering agreed, and we adopted that direction.
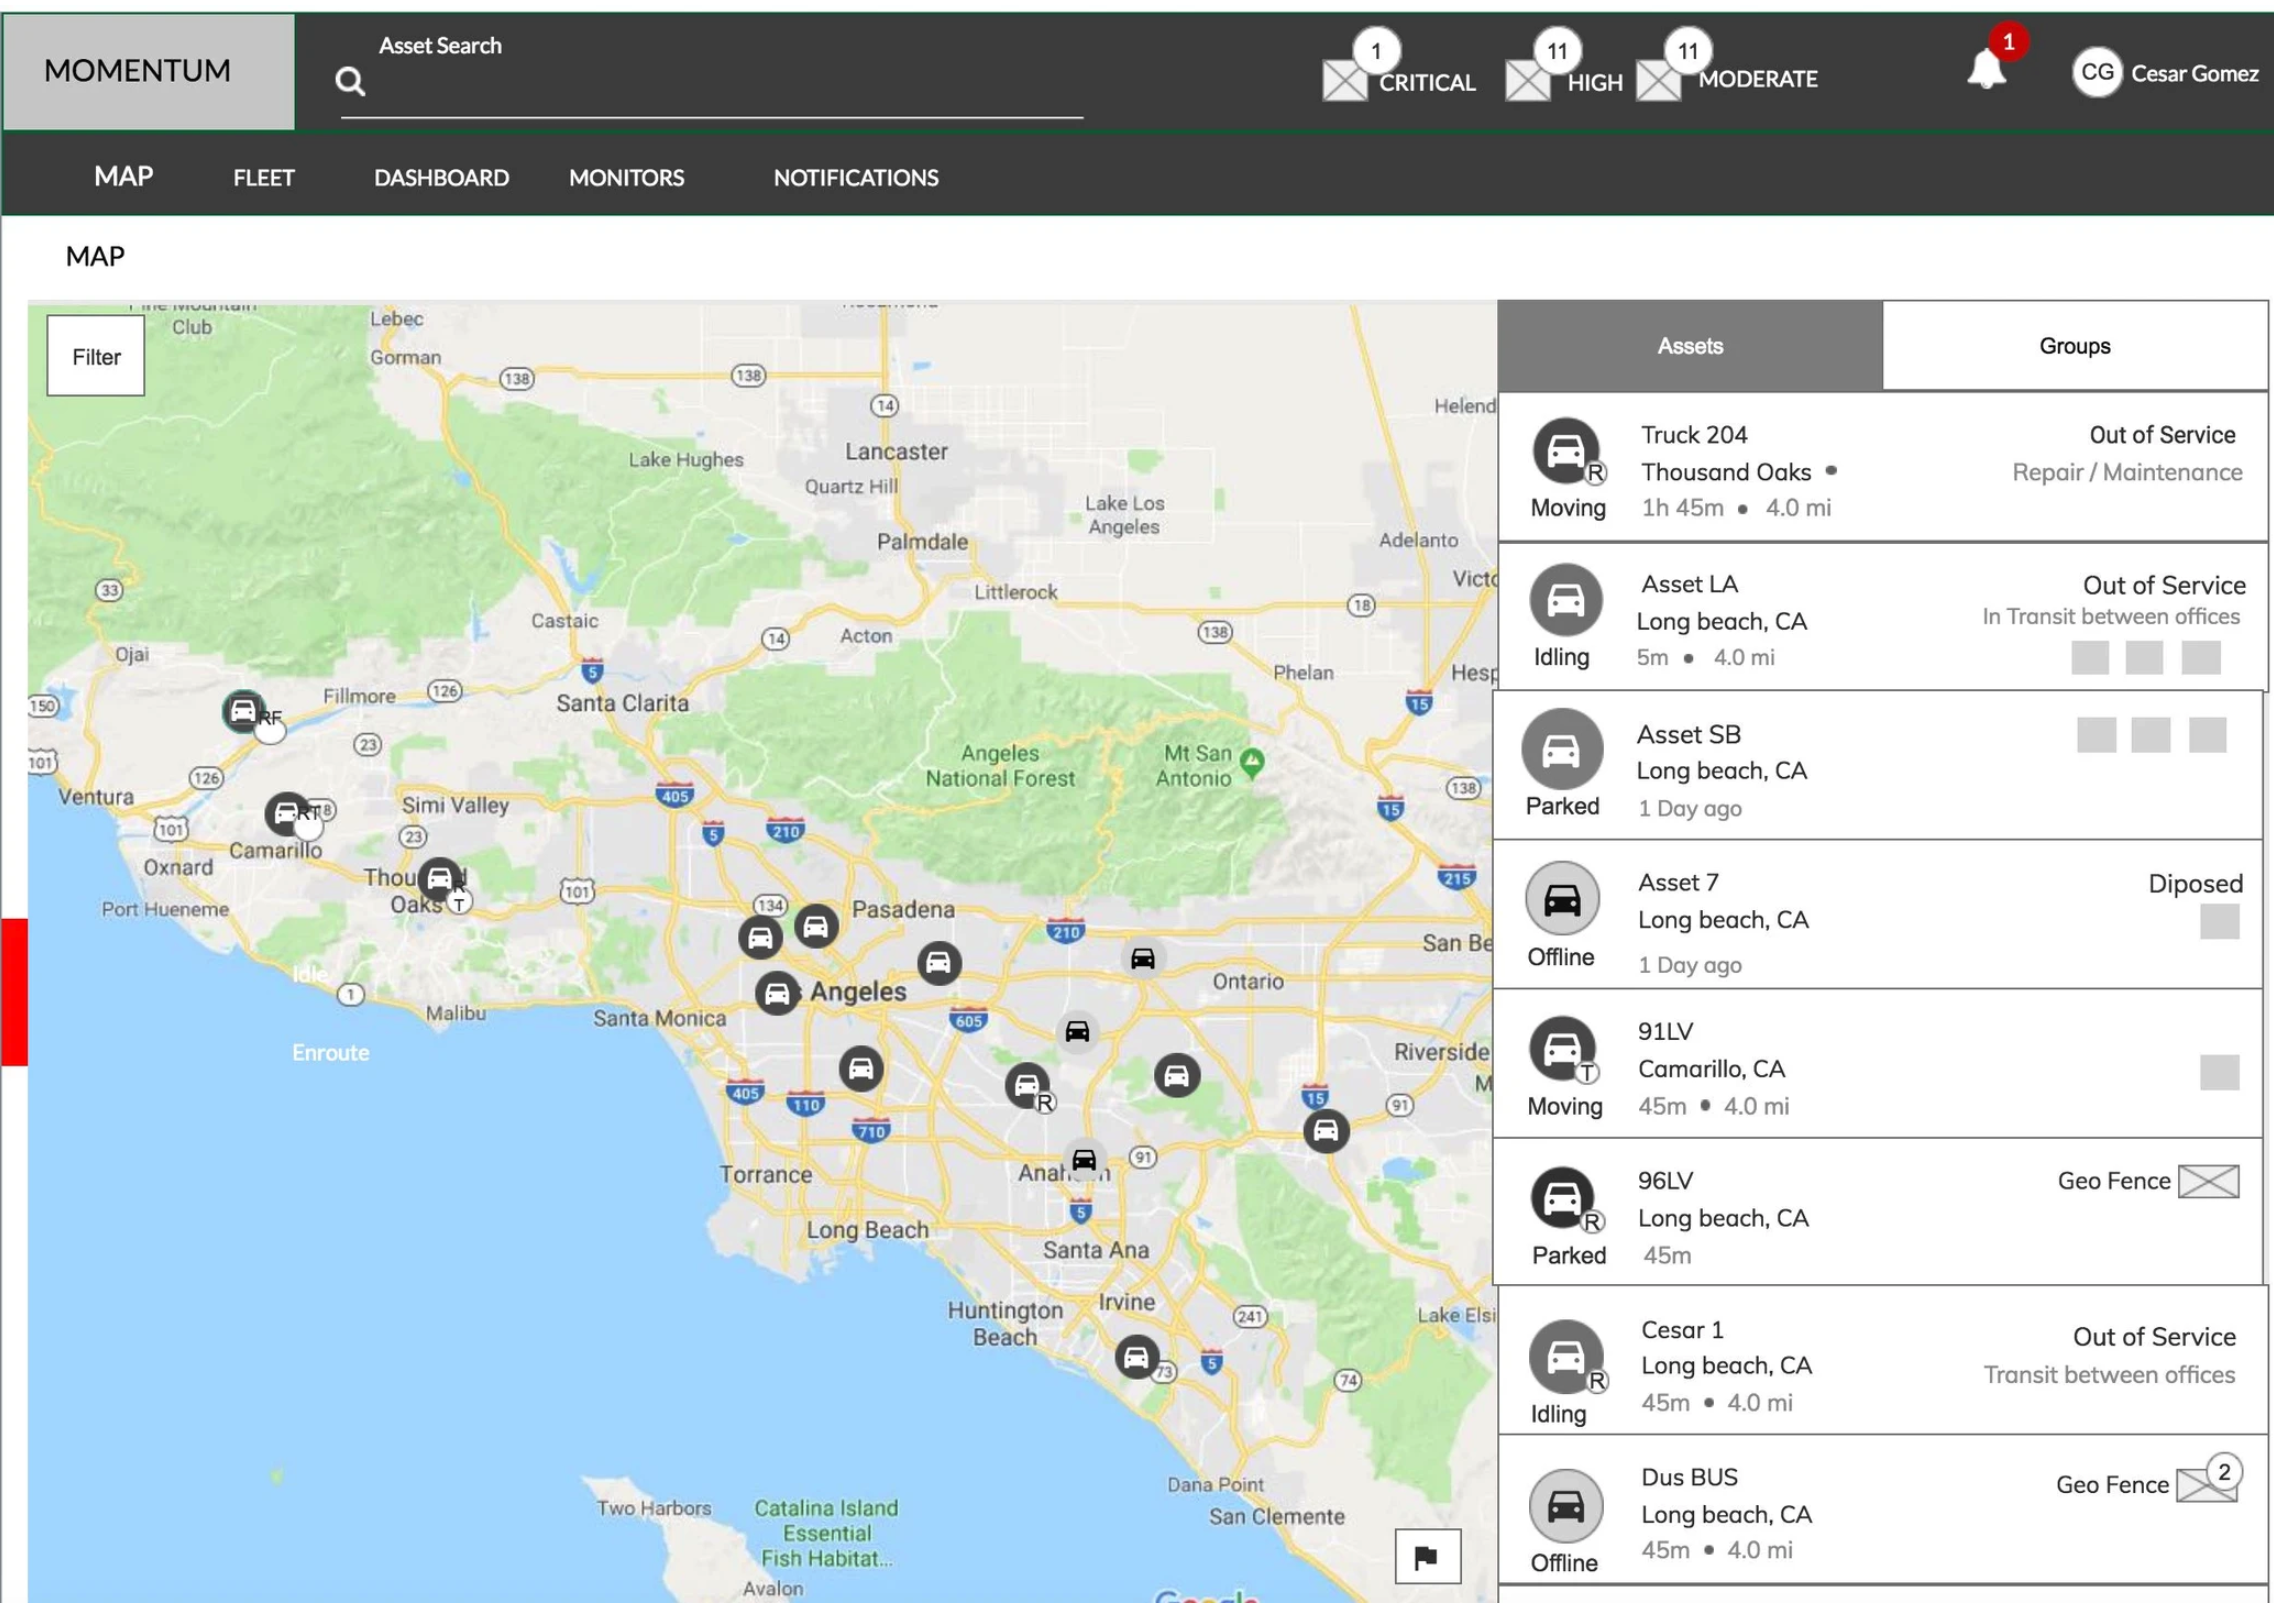
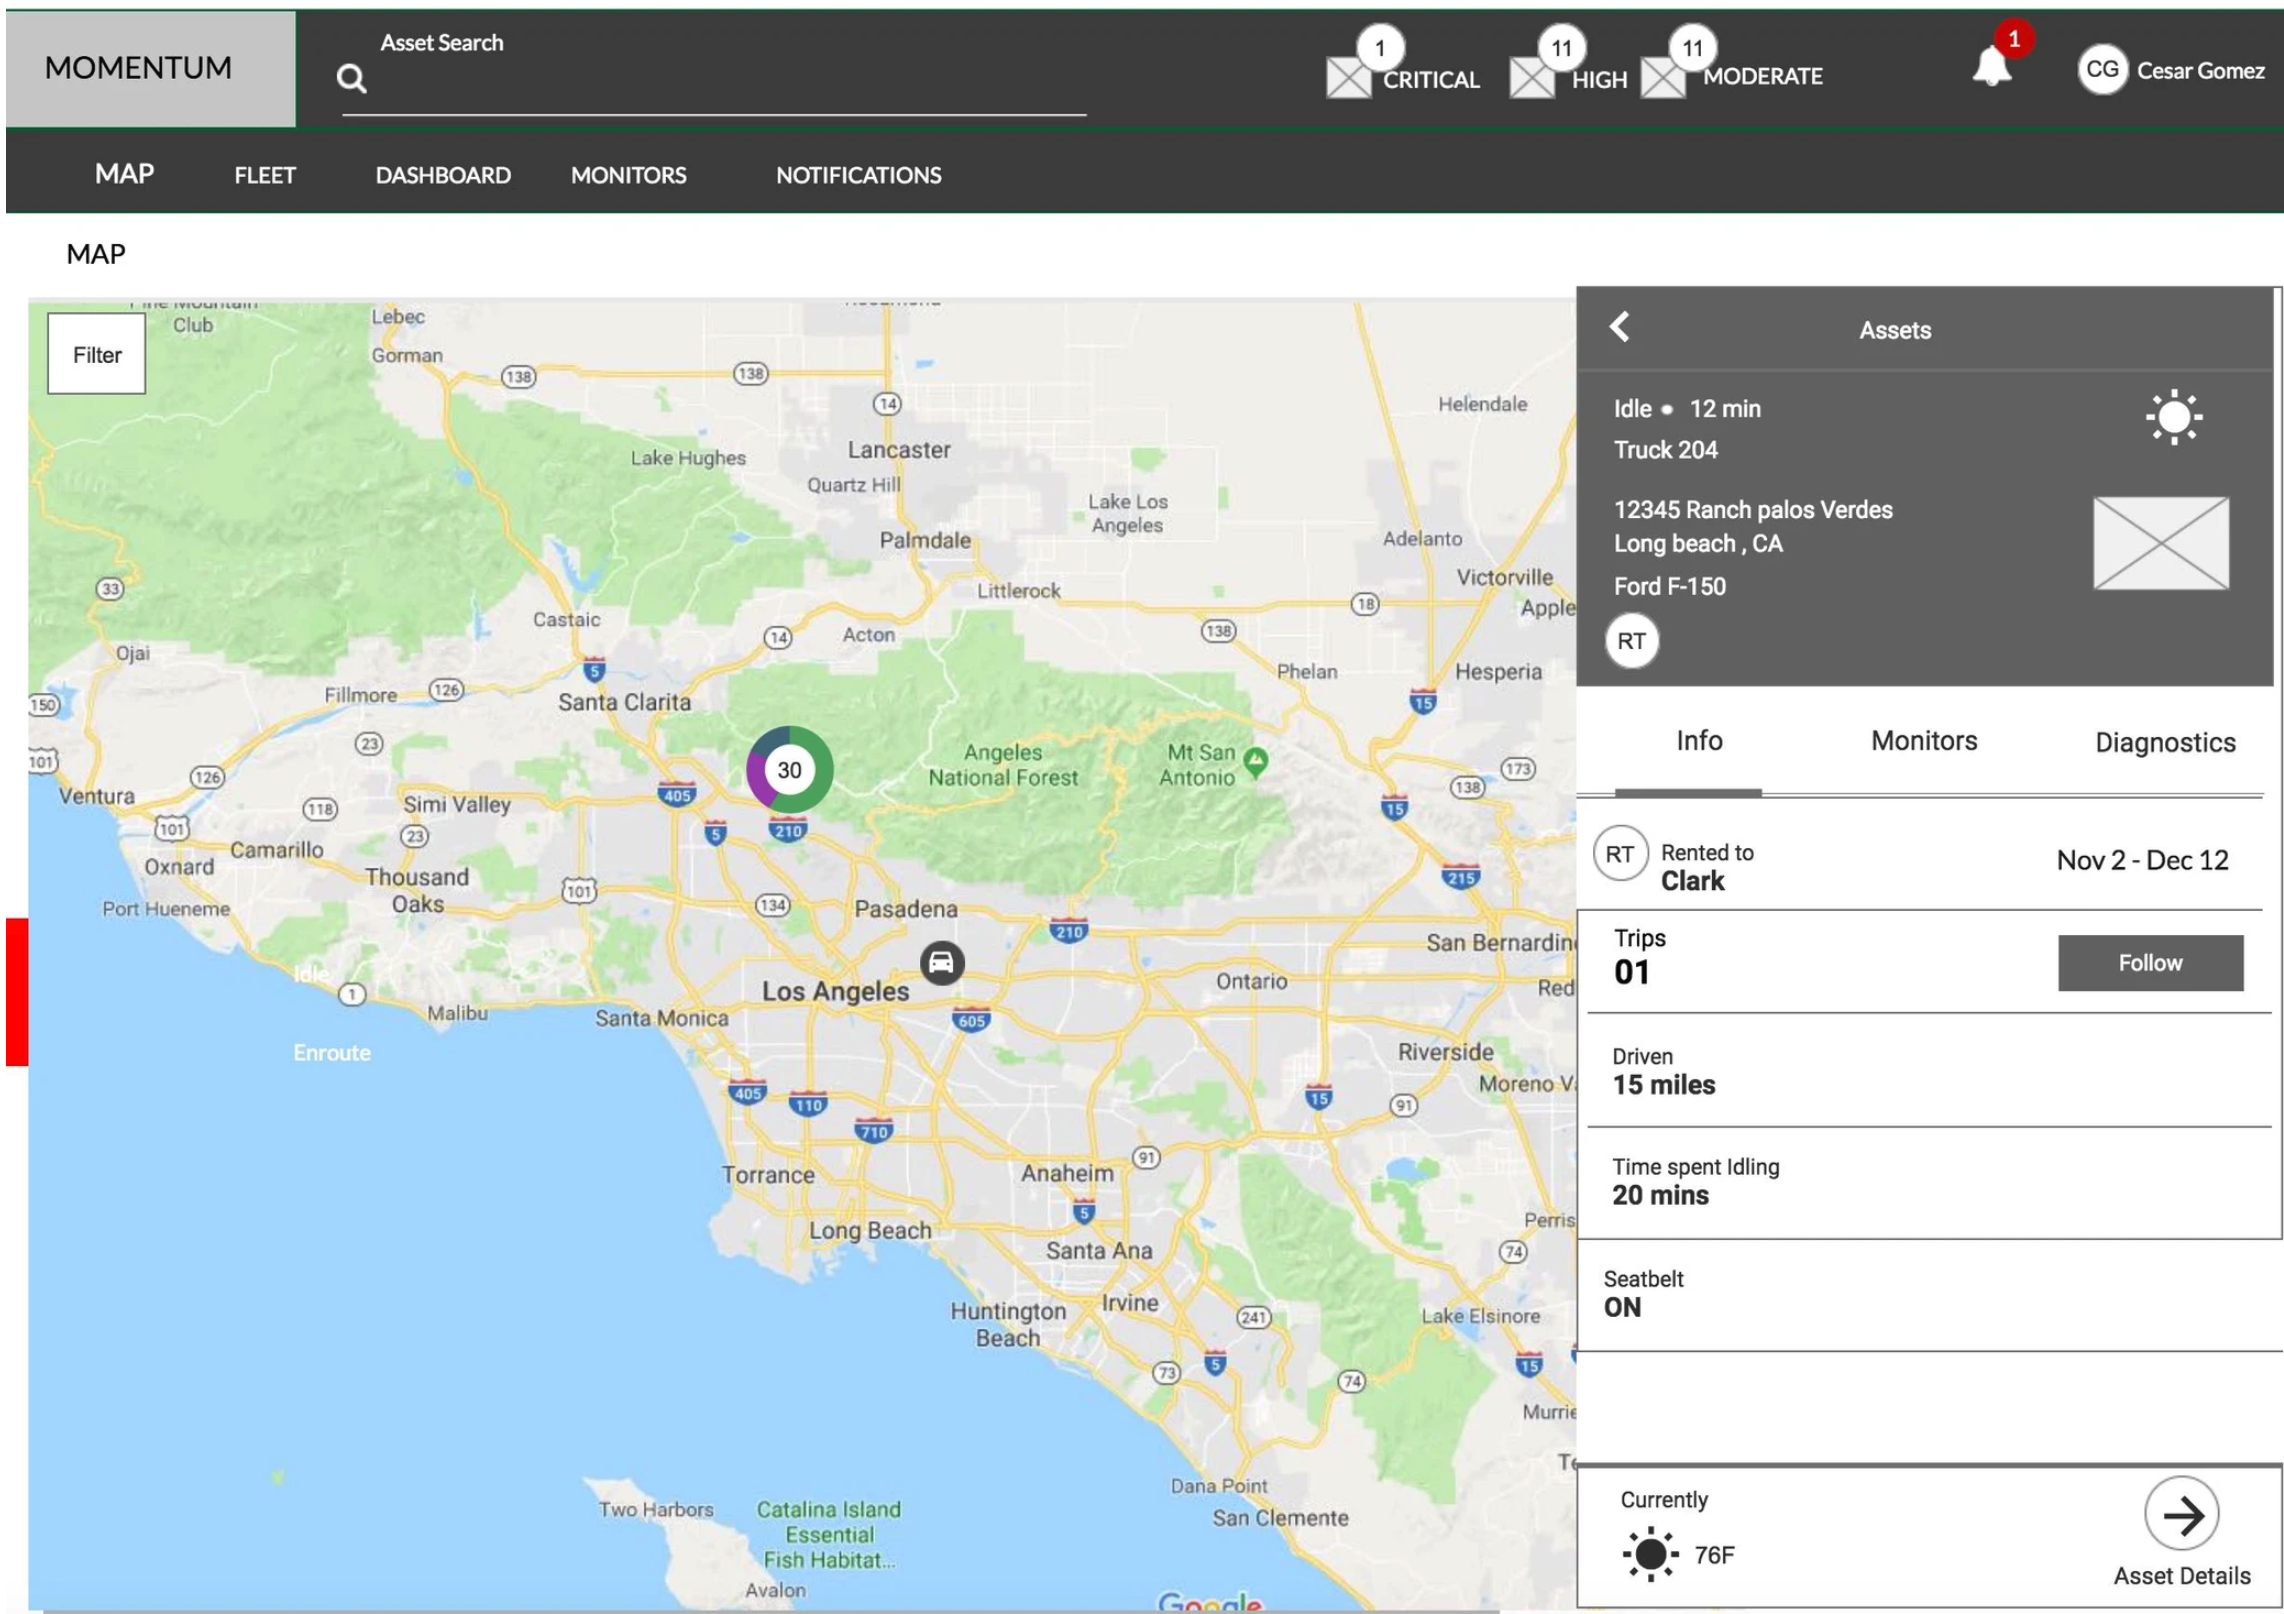
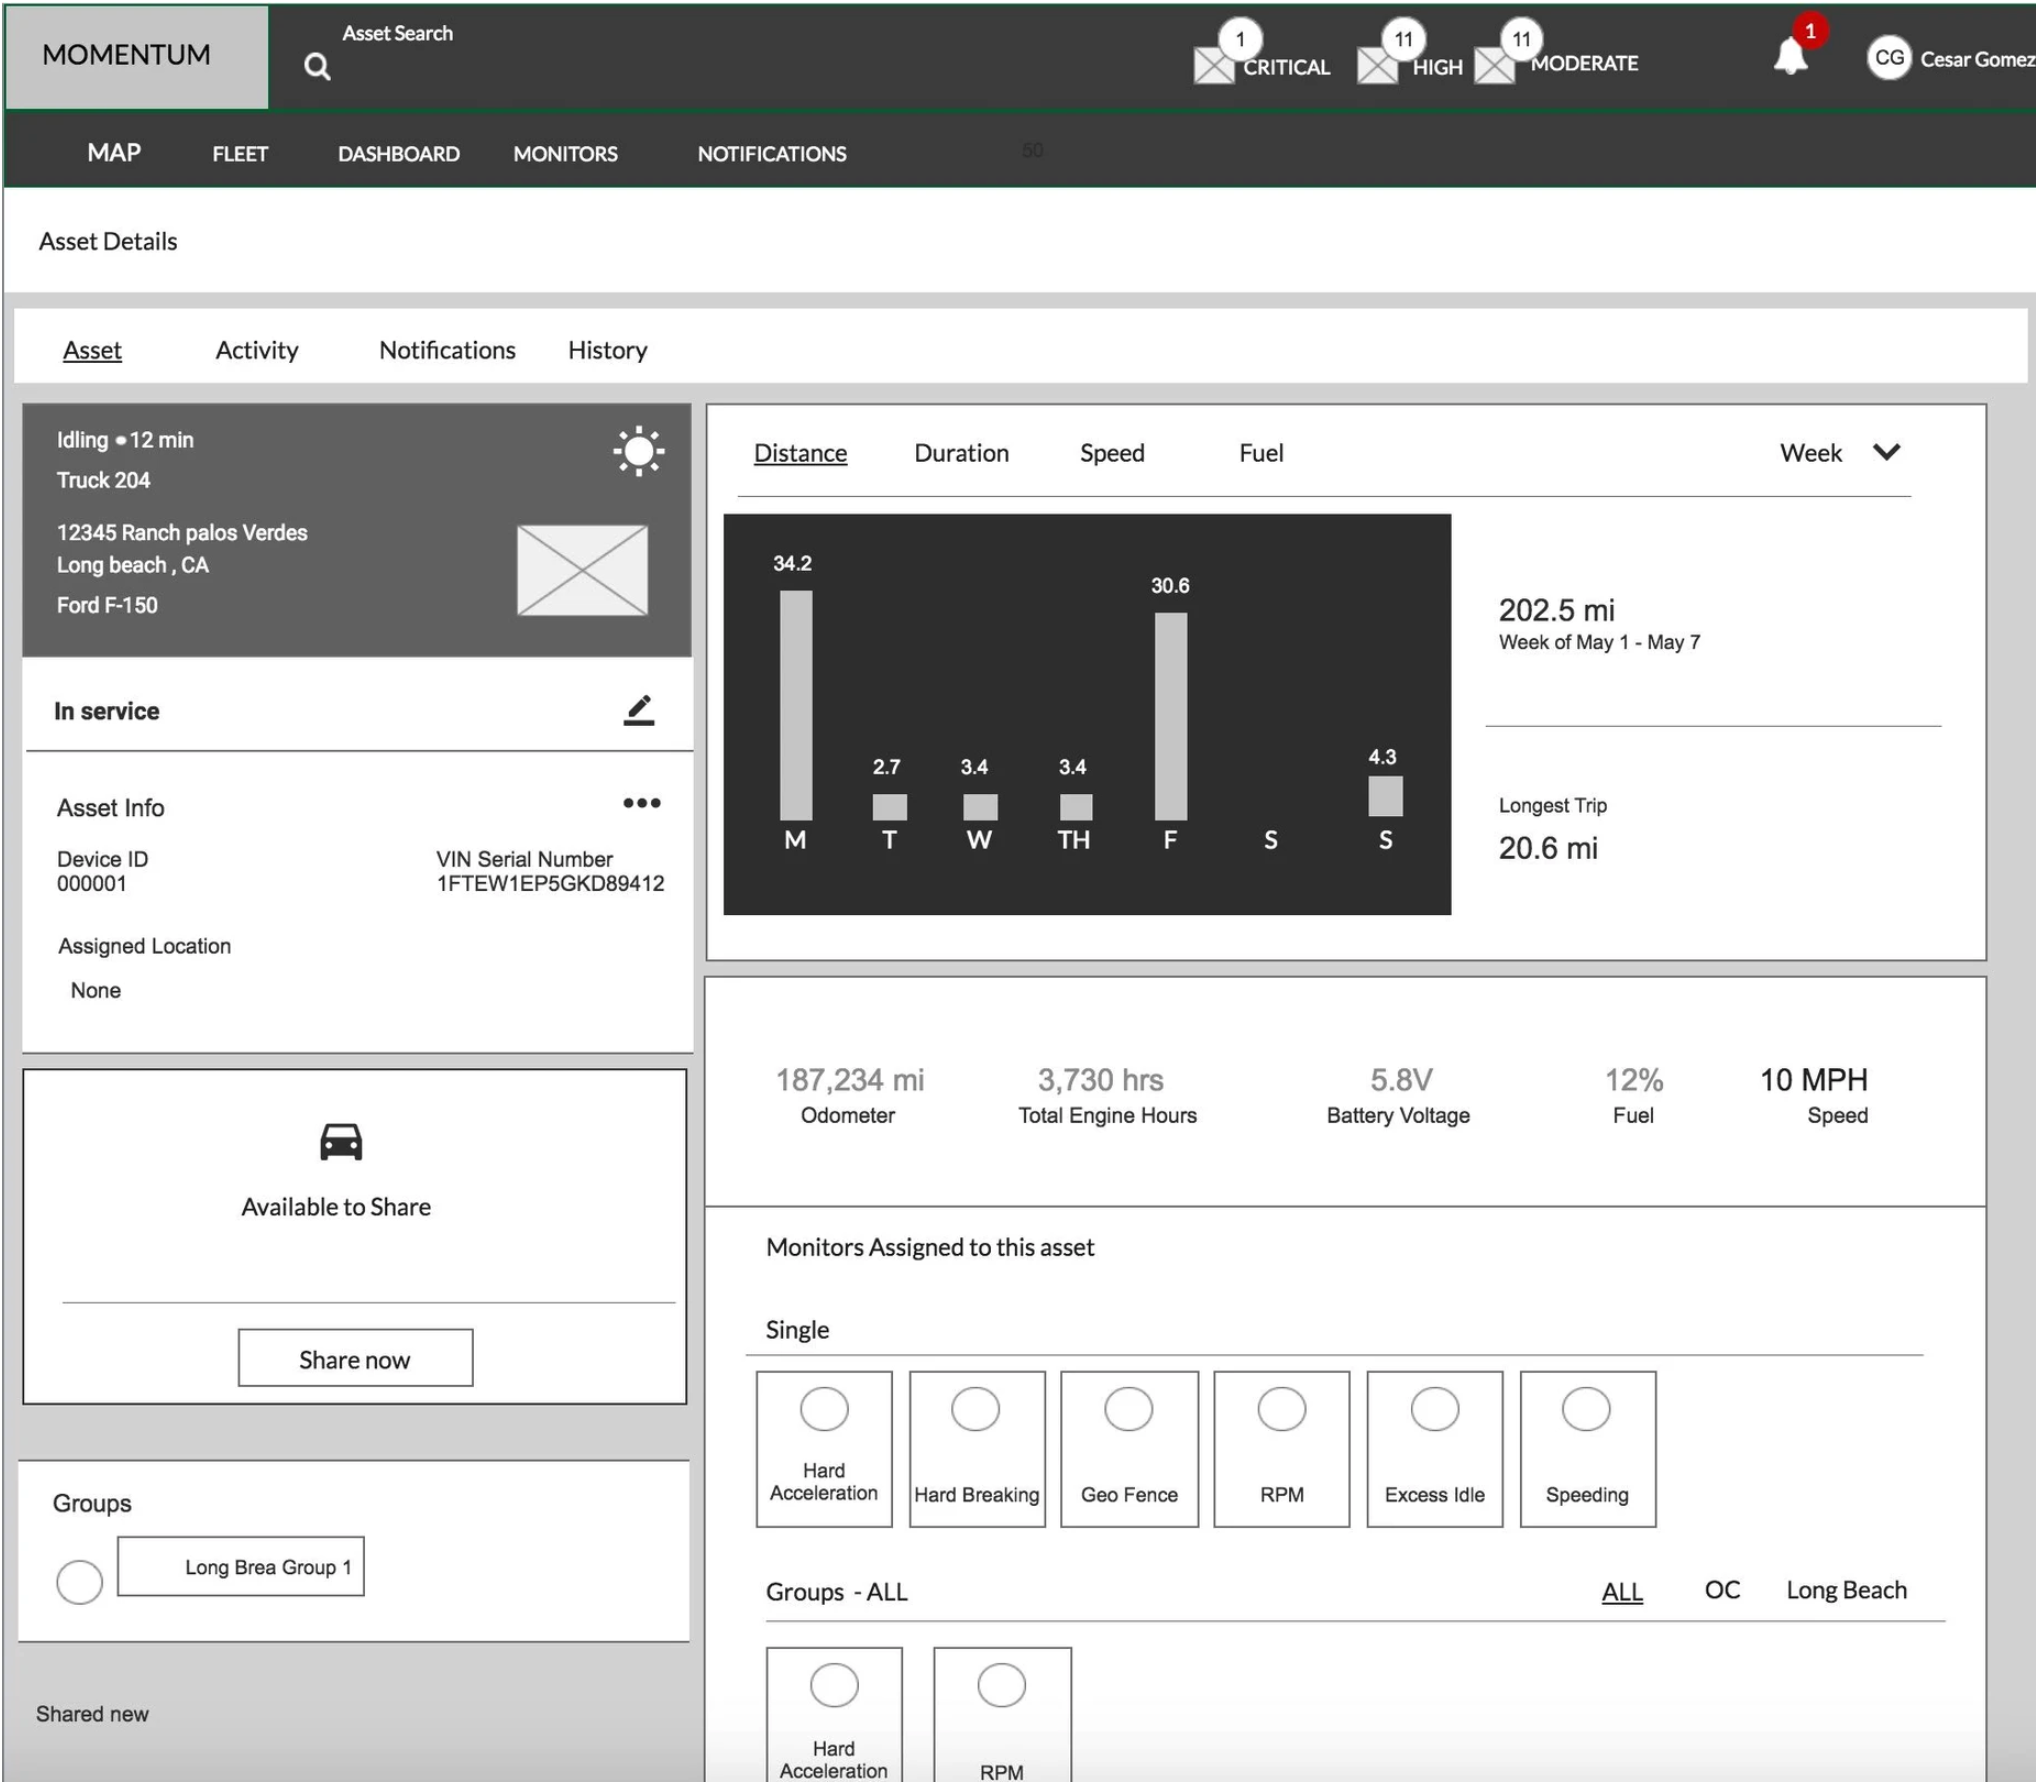
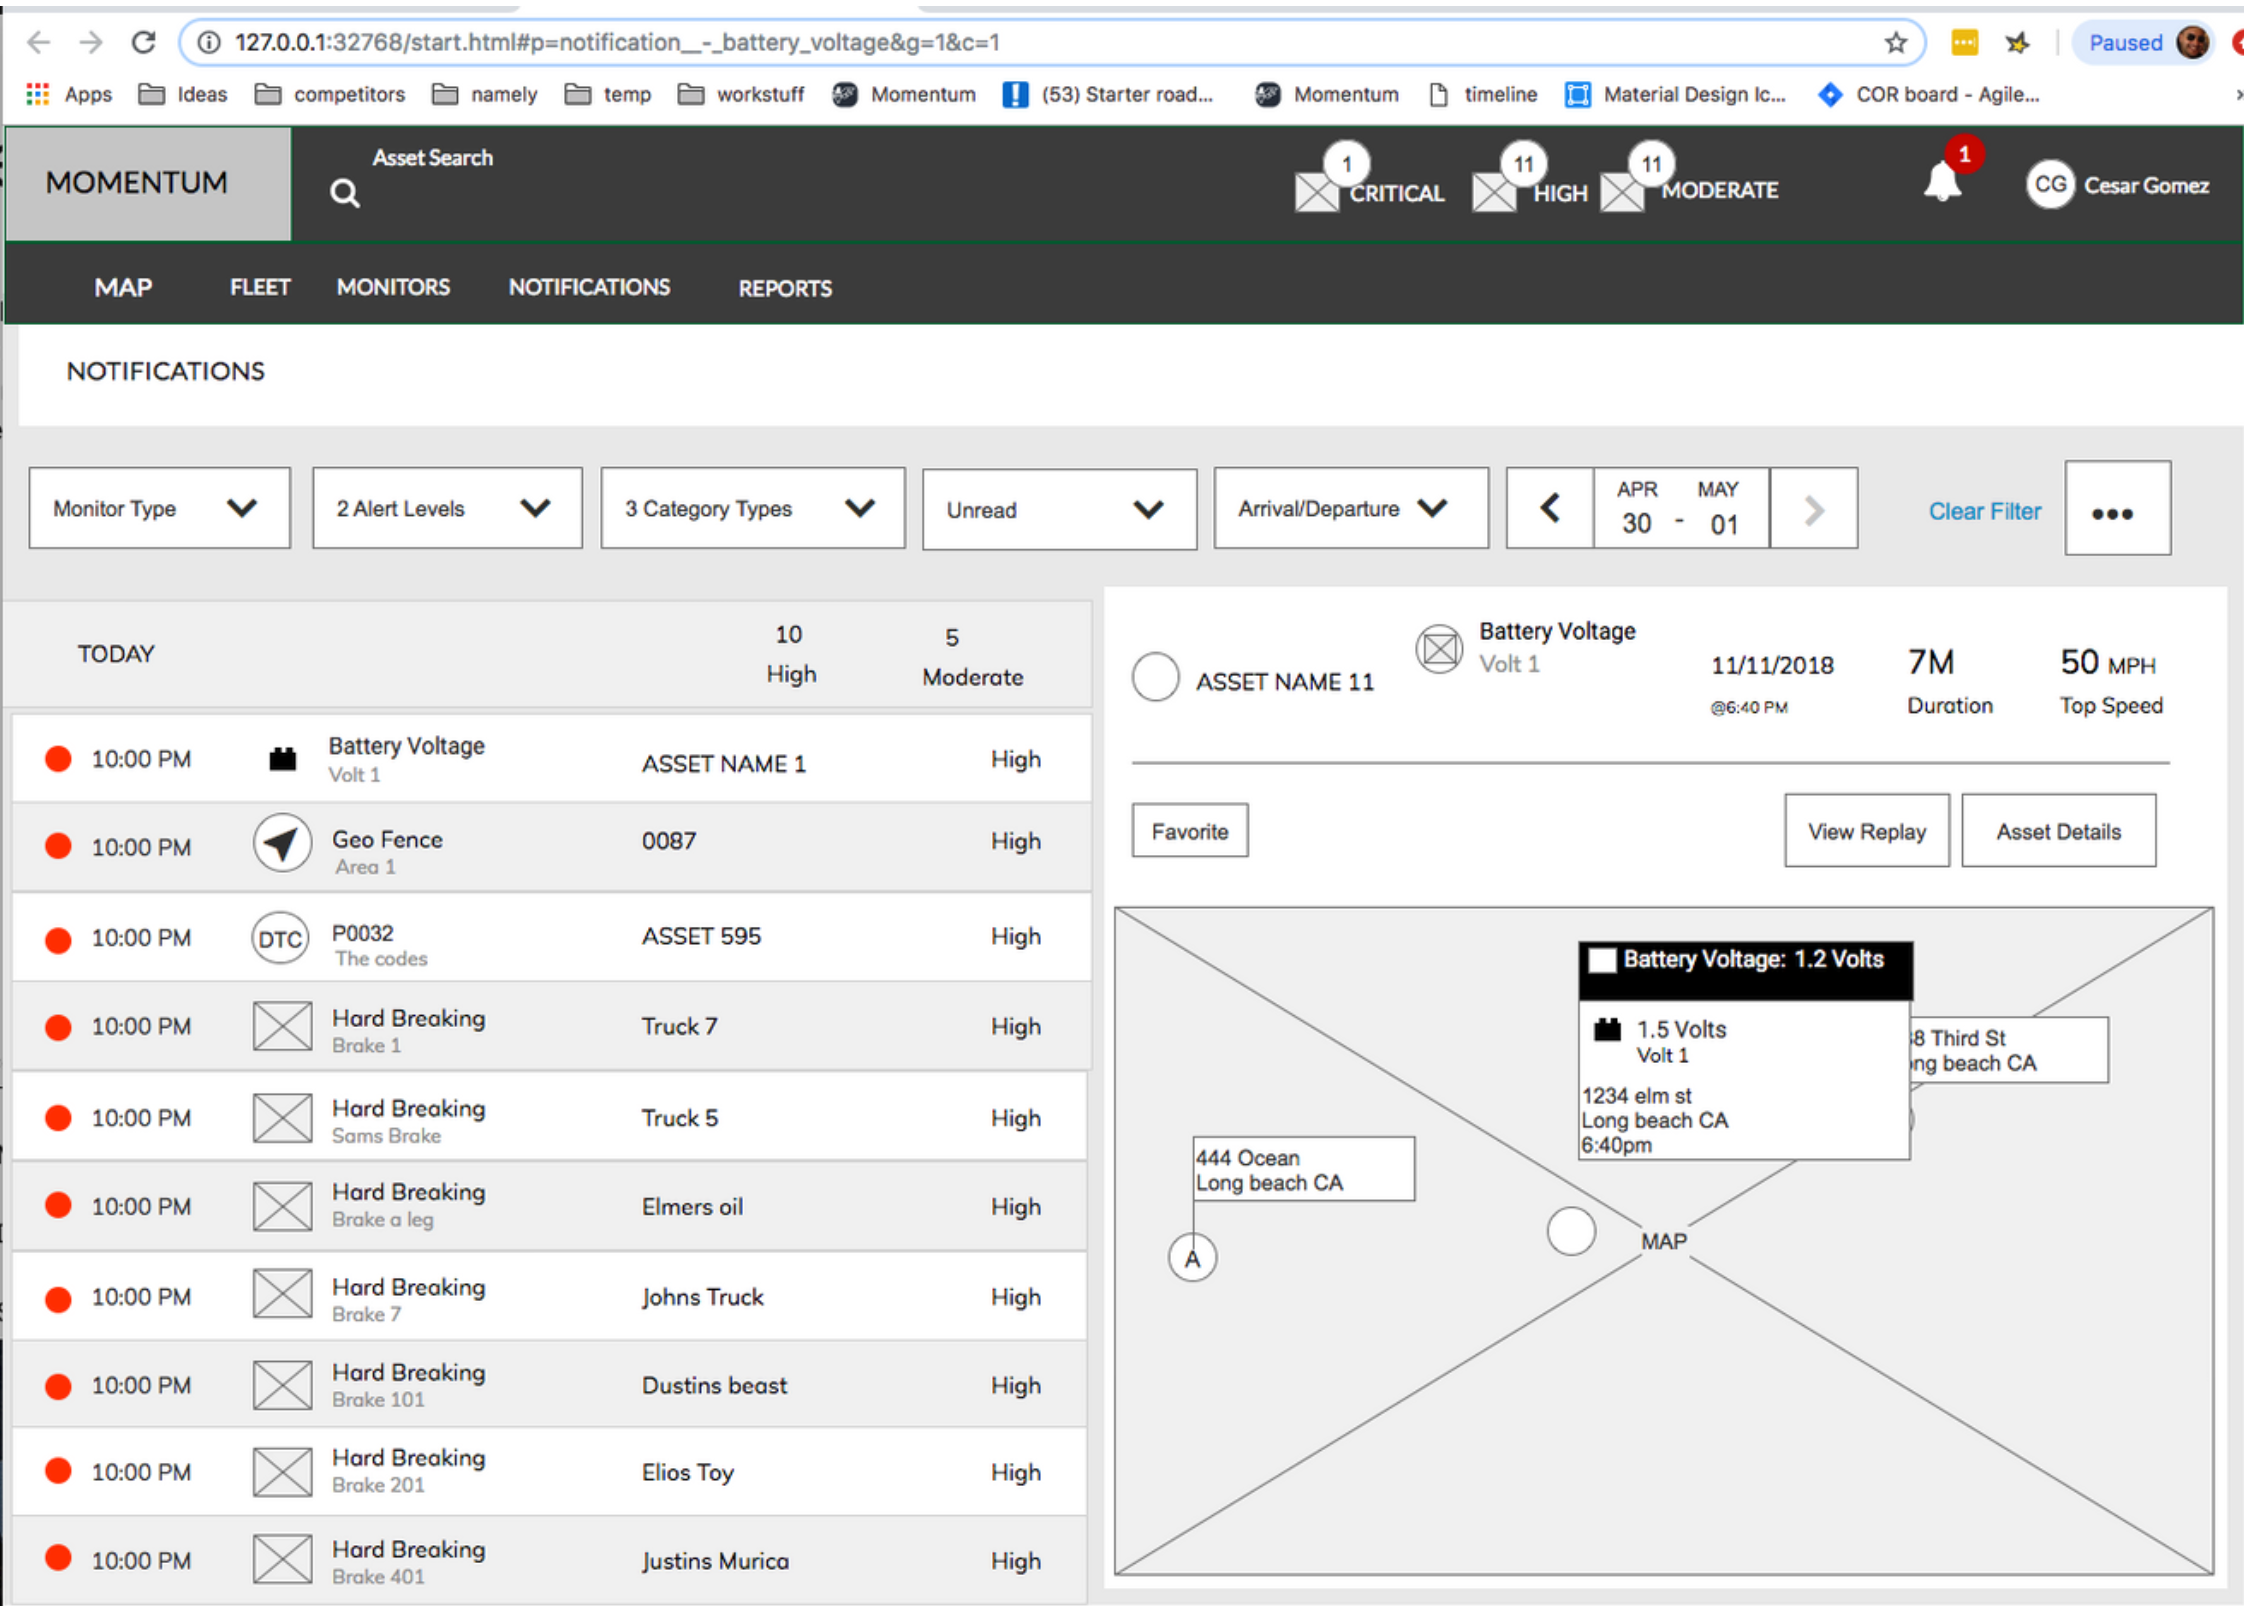
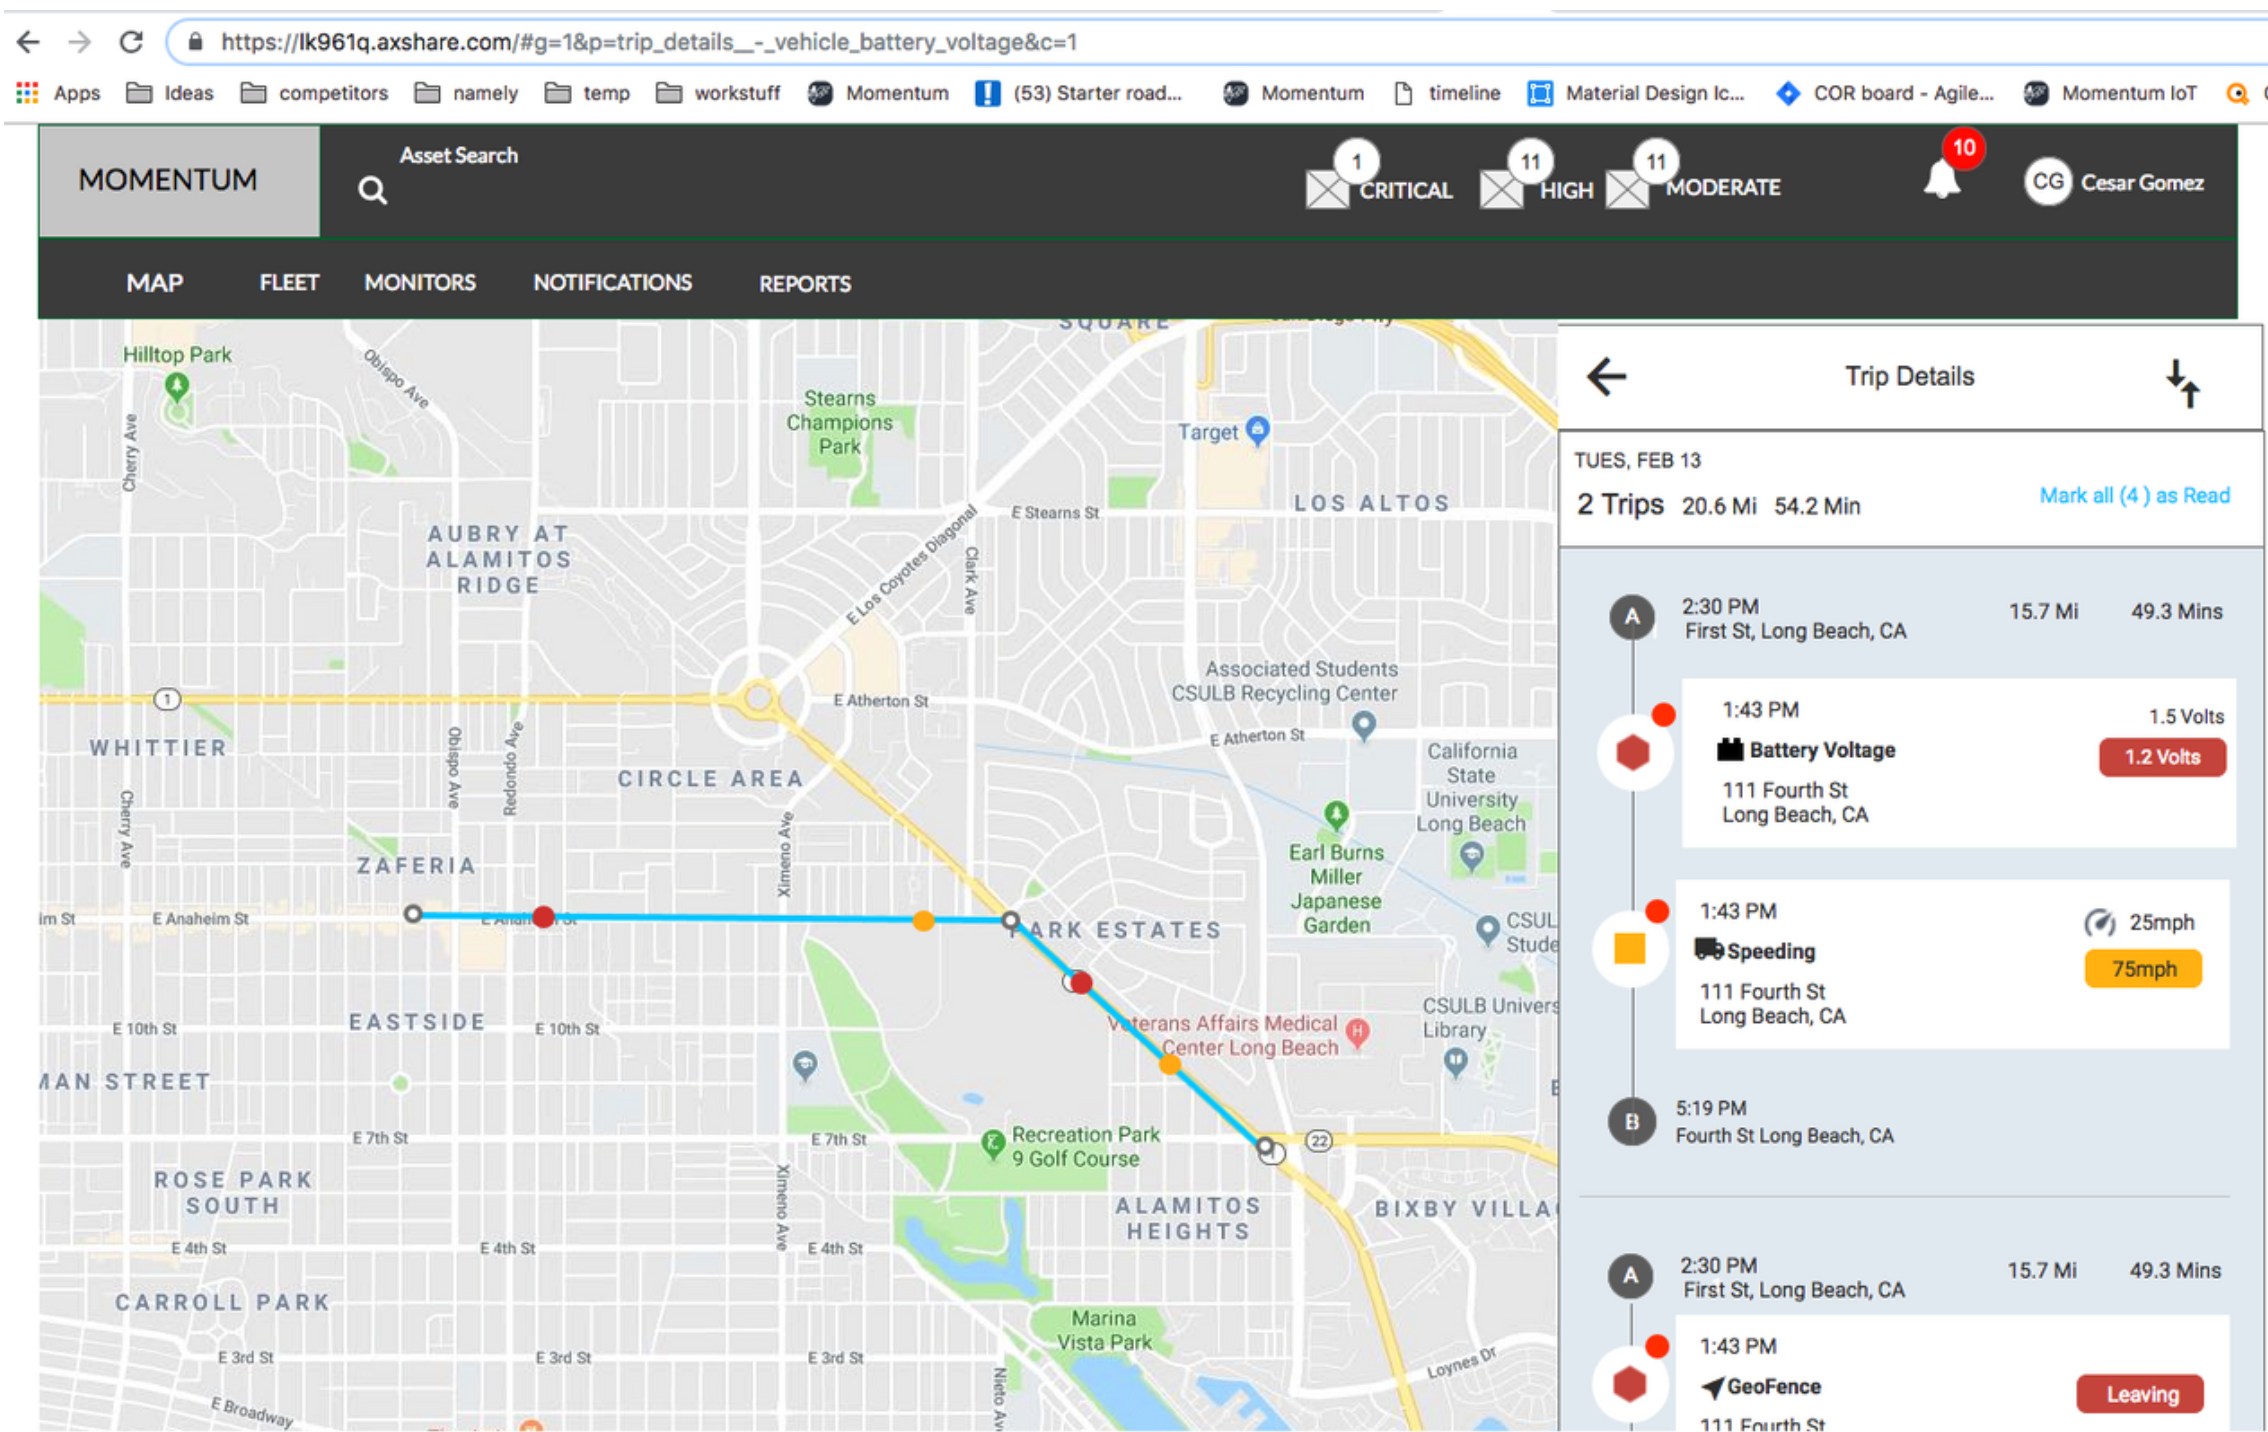
The big challenge is always being aware of cognitive load, not overwhelming users with tons of real-time information, and using proper colors for vehicle status on a map. By implementing analytics and surveys along with usability testing, we understood our users’ thought process and how they actually used the product.
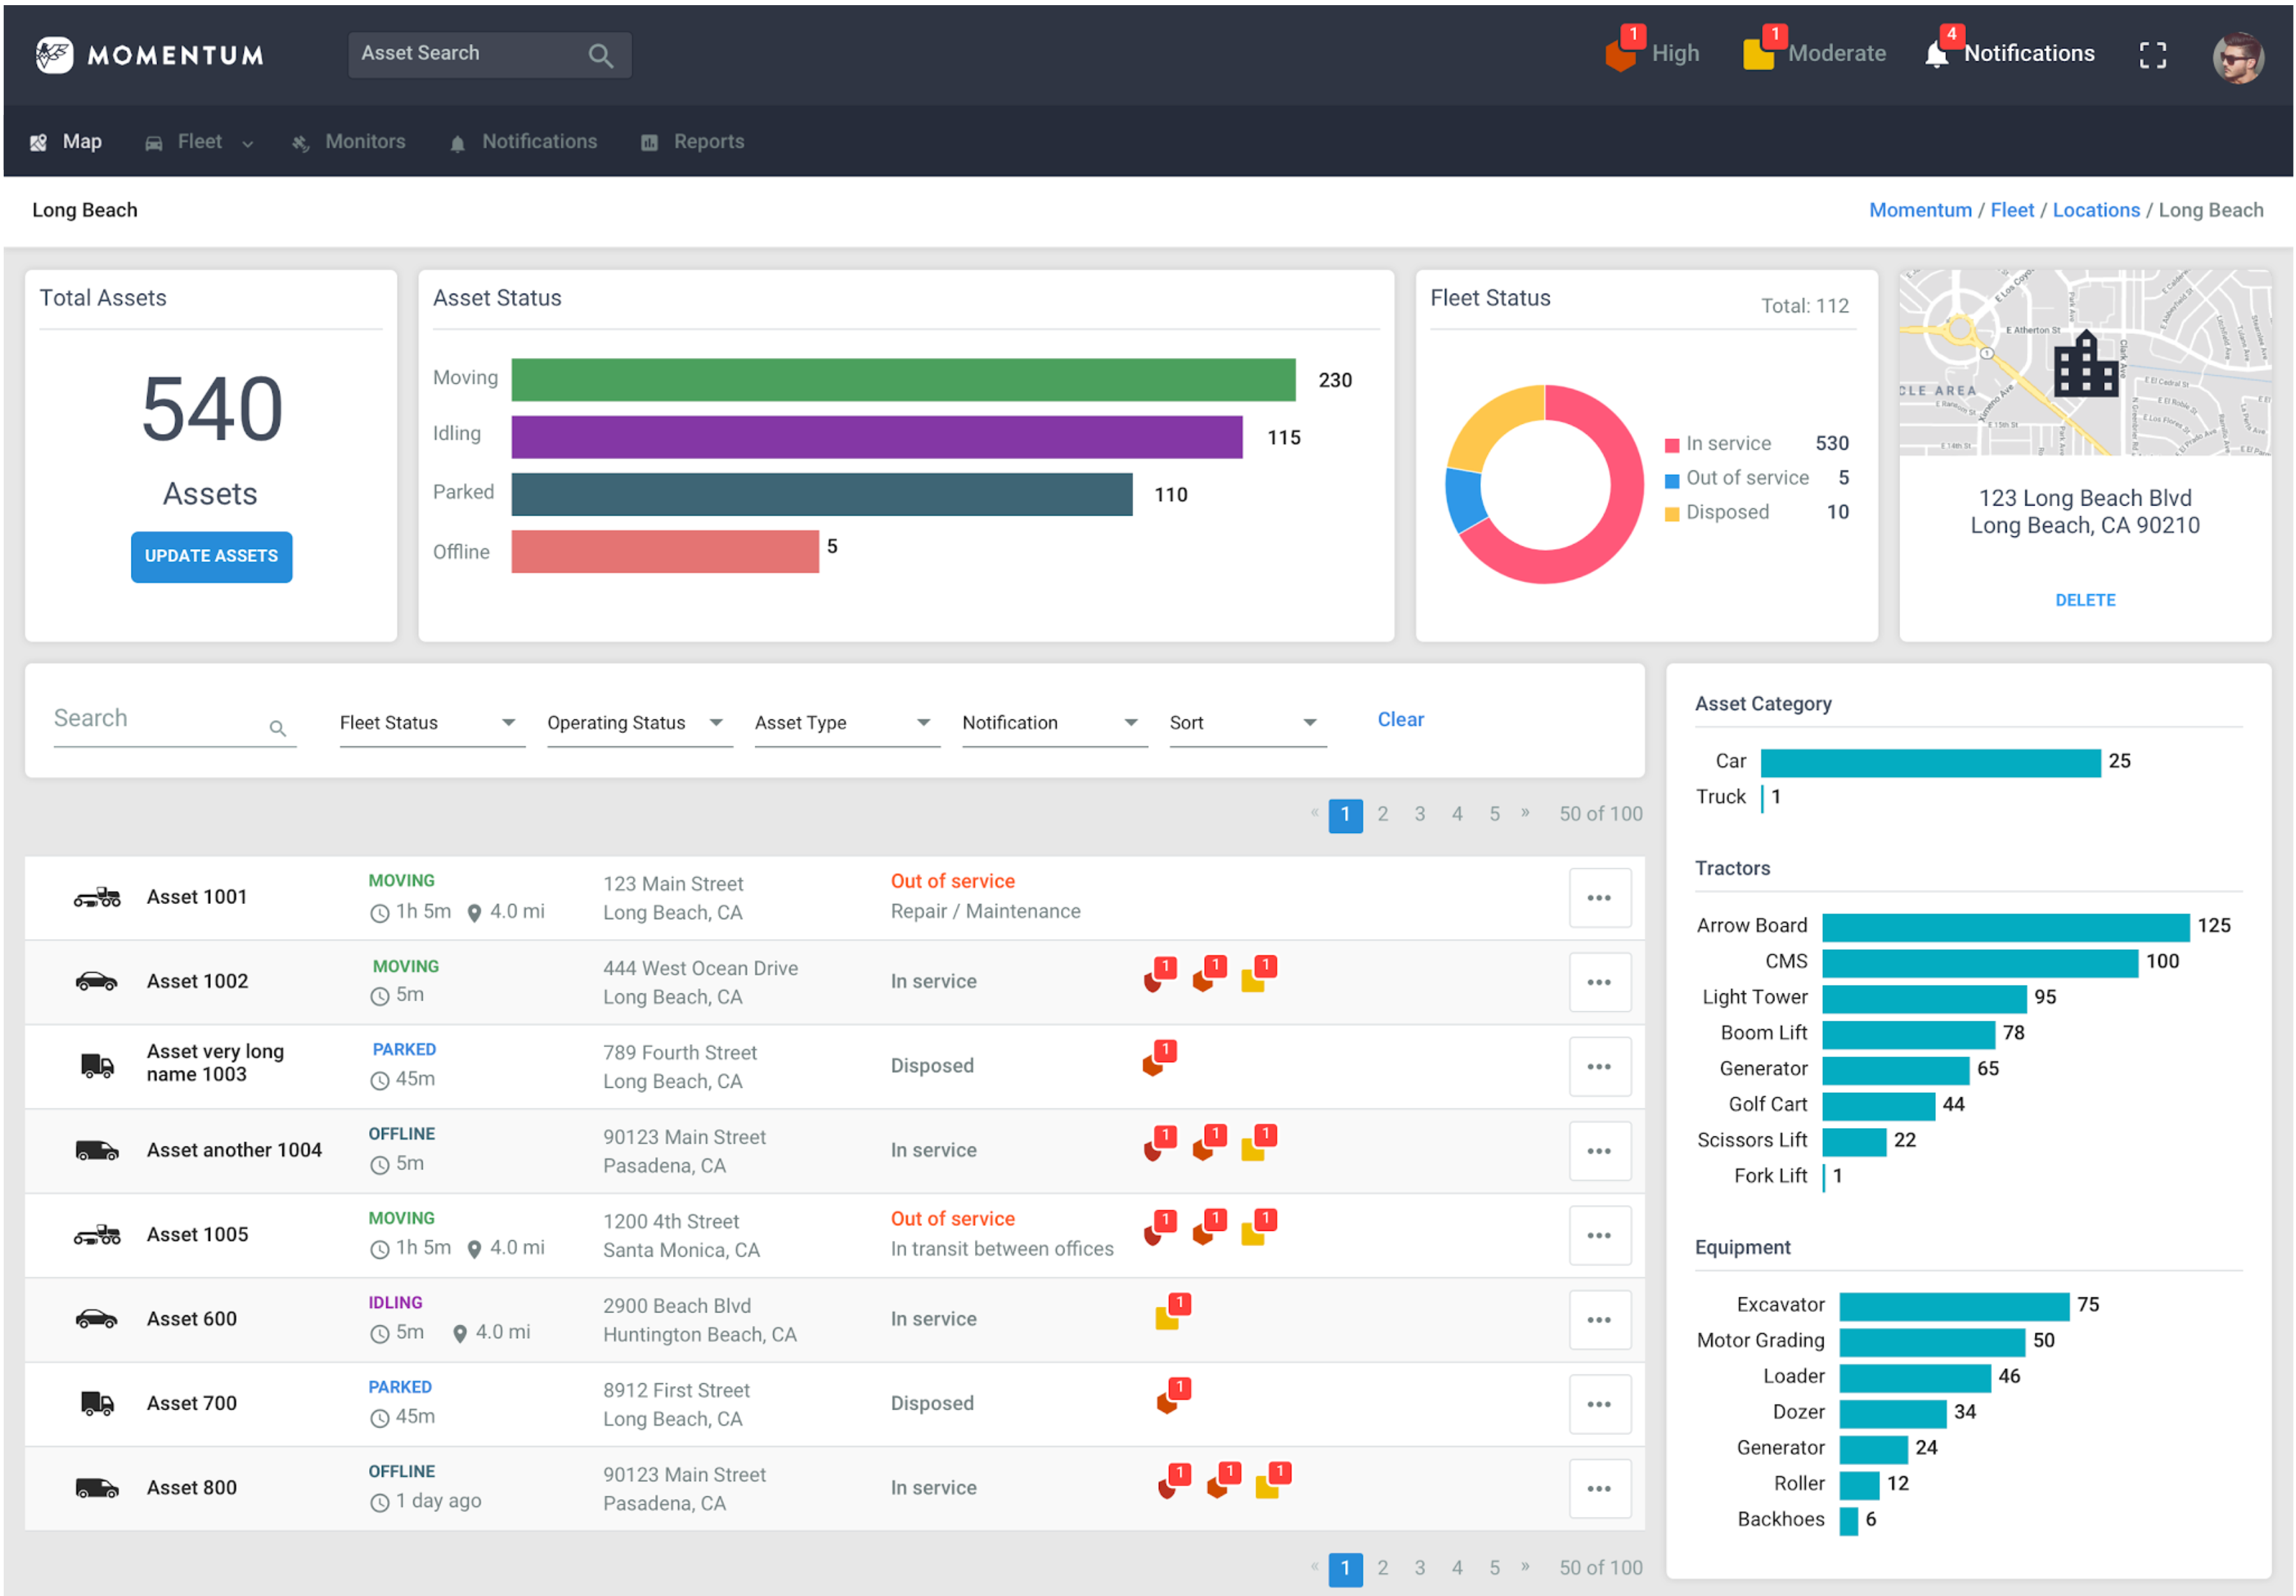
After MVP my team and I continued building out the product. I went out into the field, and it was great seeing how our customers used our products, along with their feedback. We eventually created an app and continued iterating on the product.
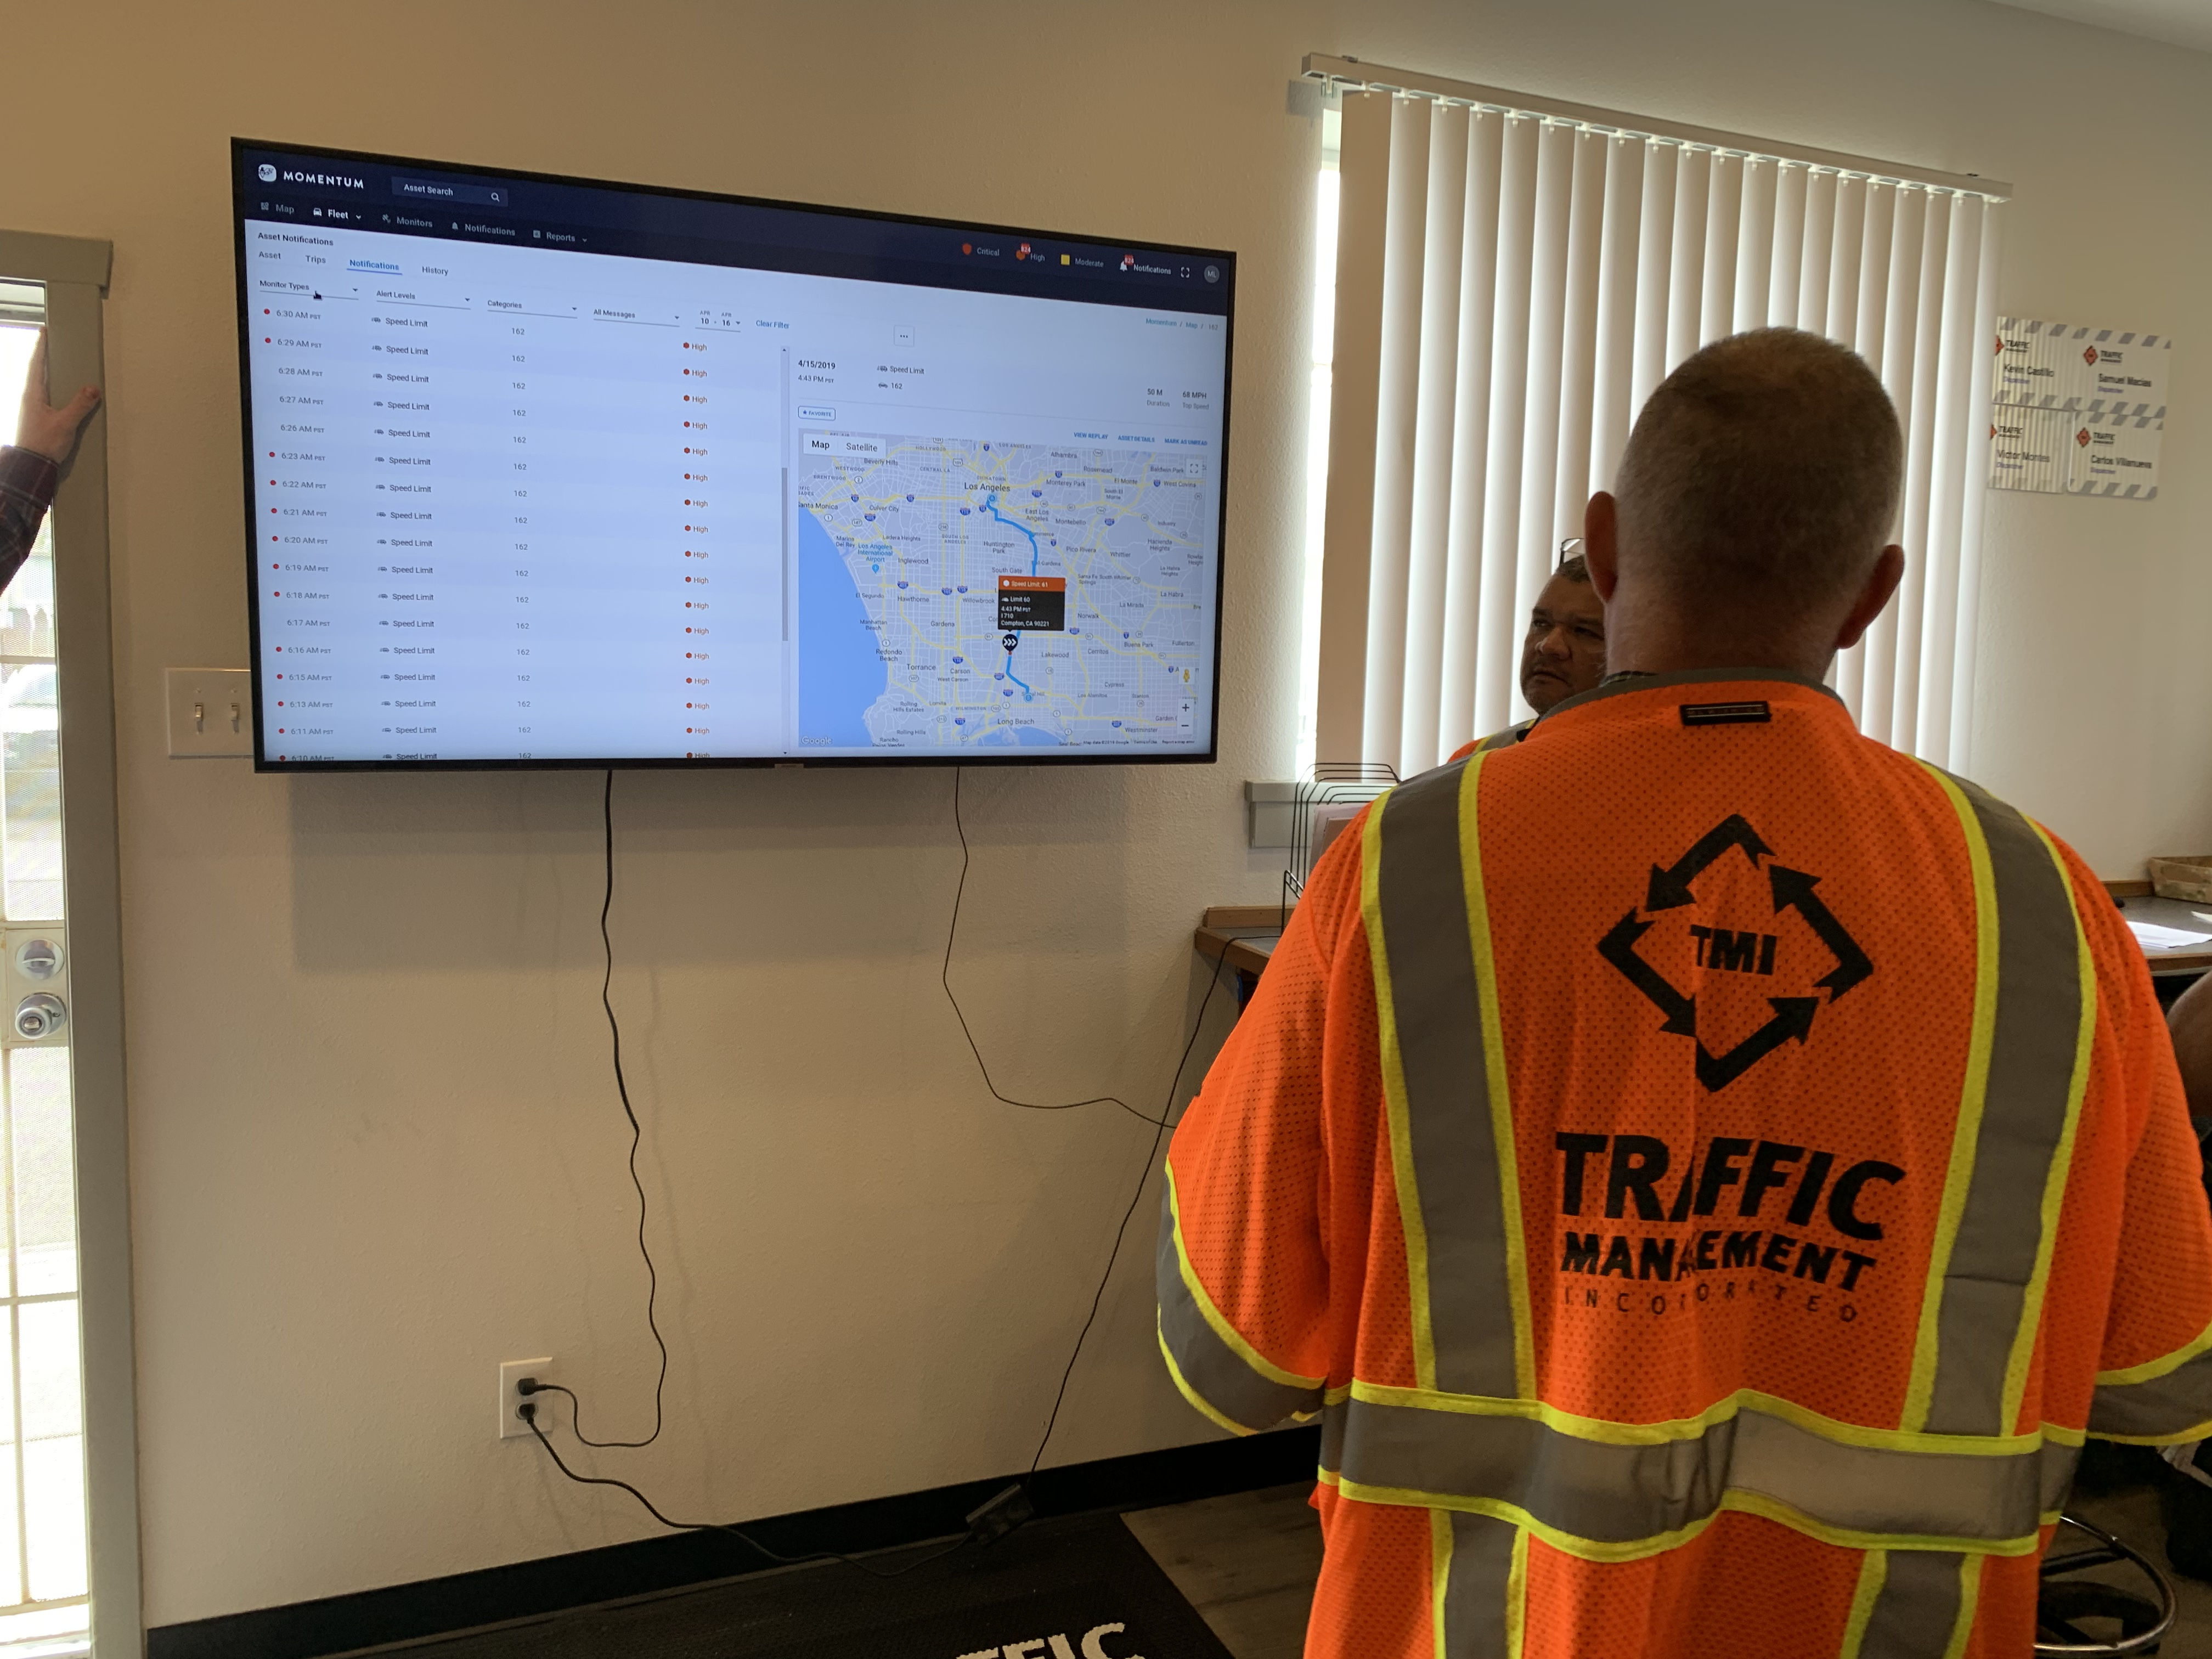
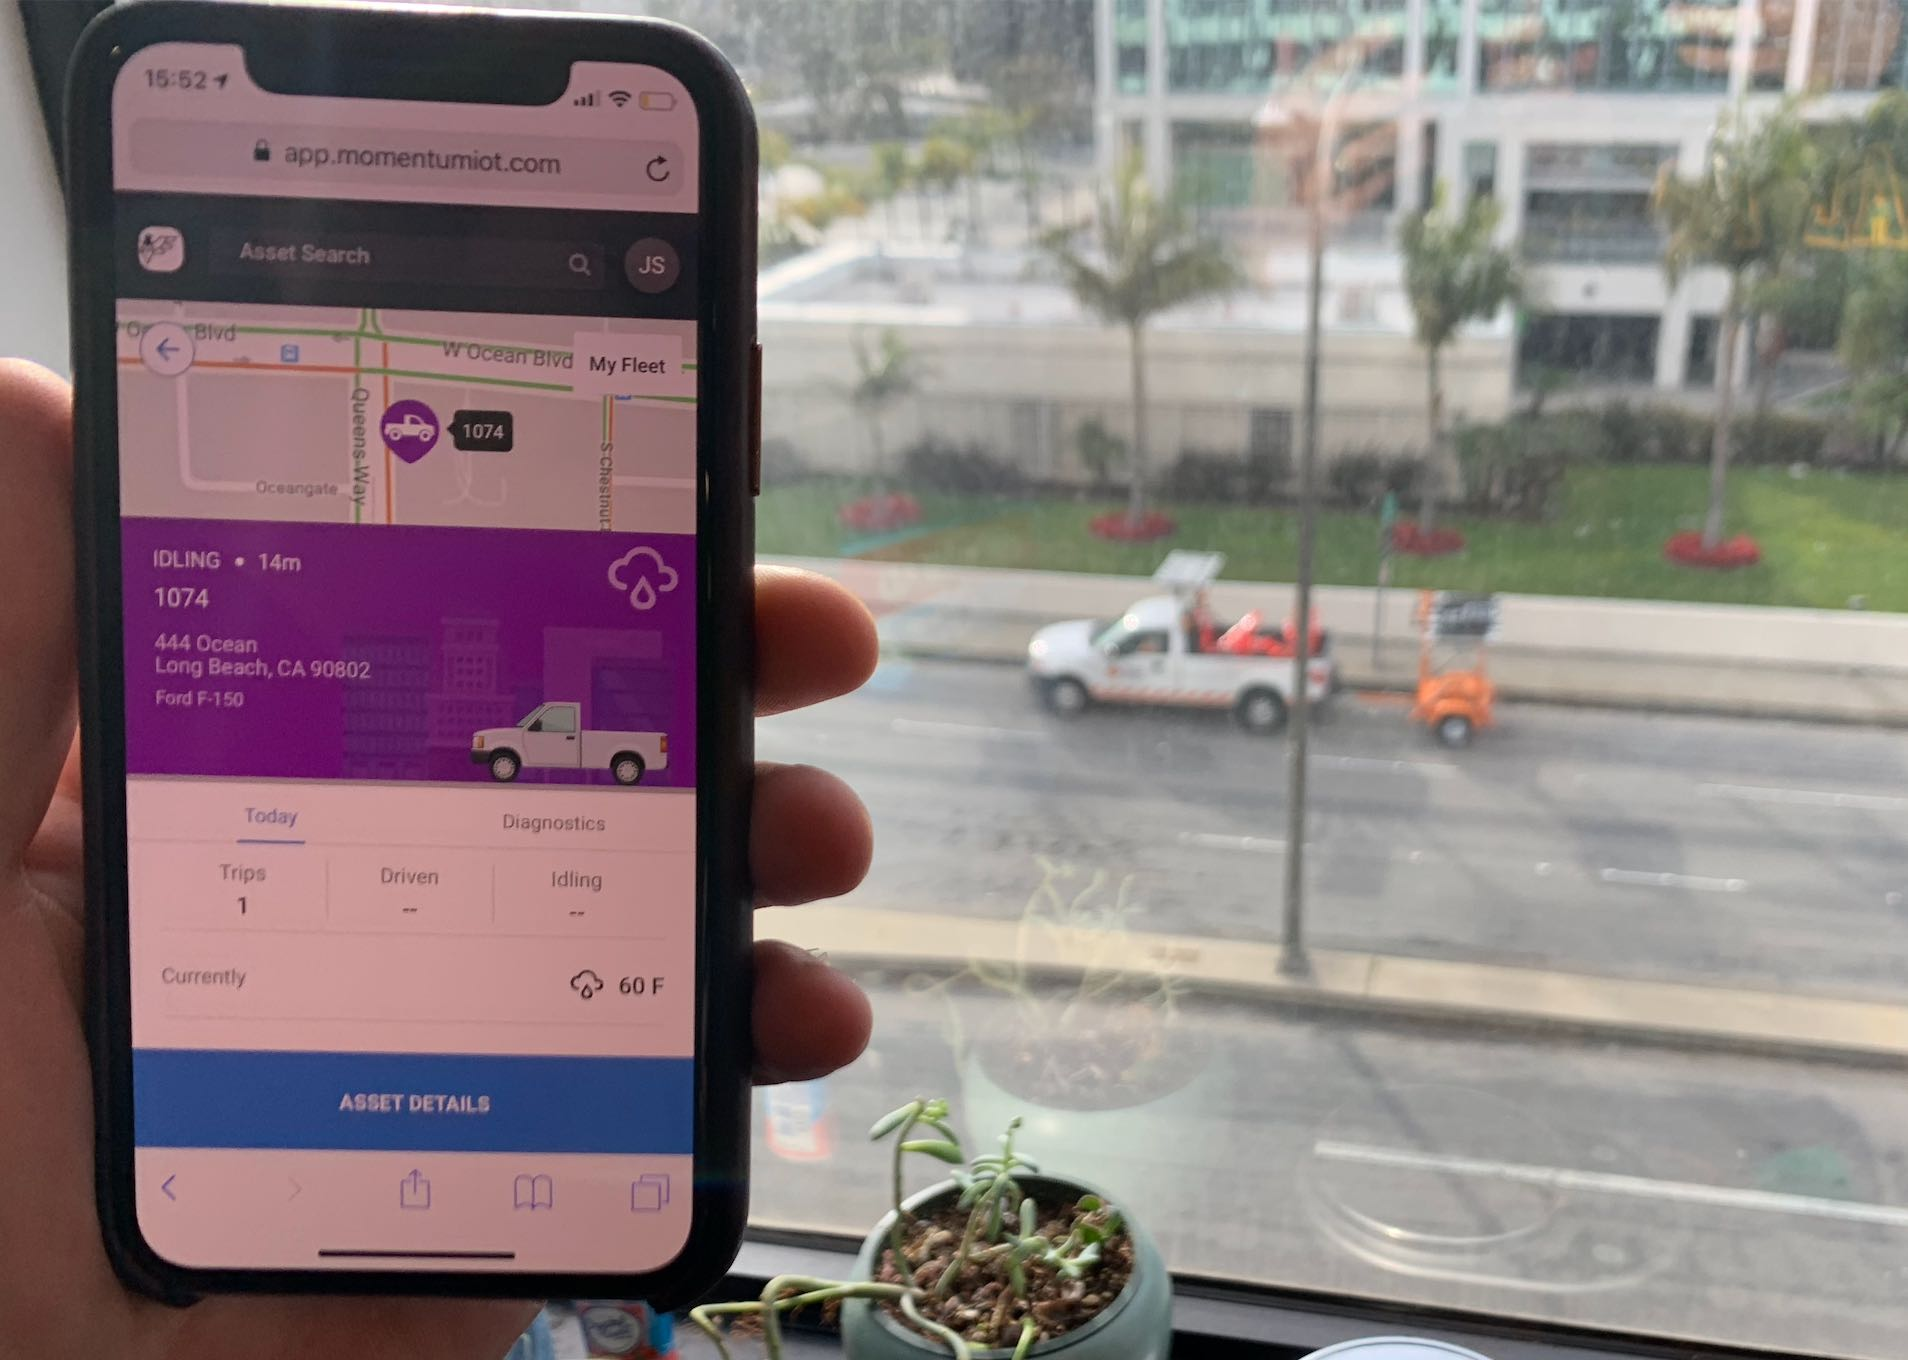
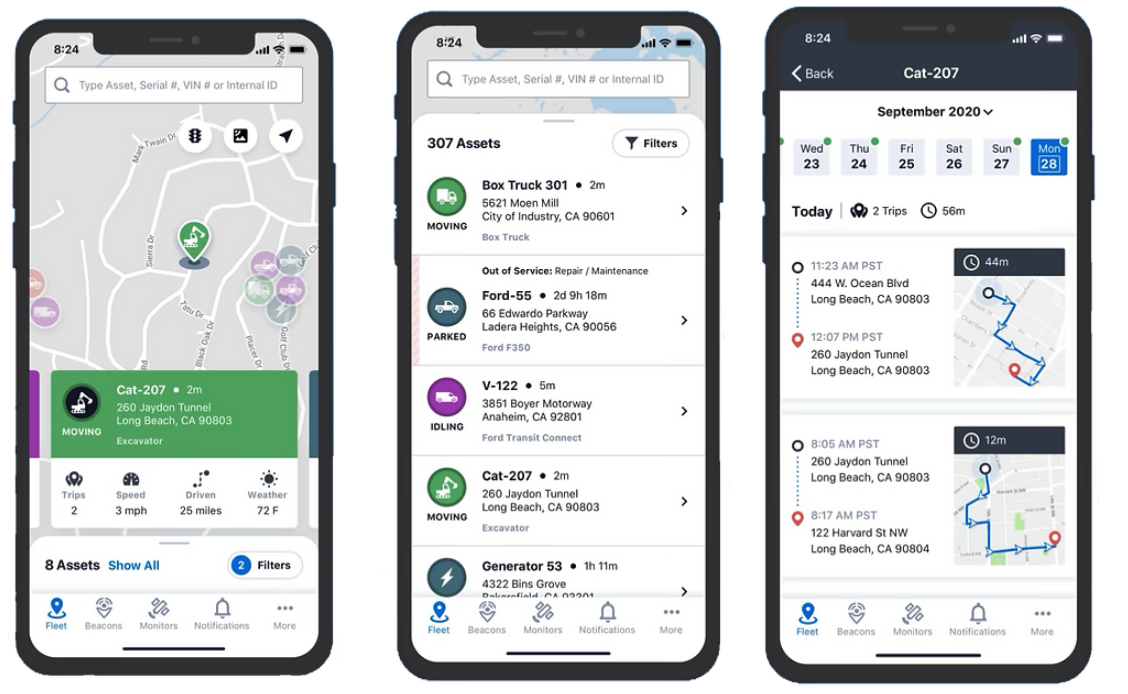
Shared asset visibility, a simpler experience, and a roadmap shaped with customers.
Tracked across industries, from first responders and plumbers to the City of Los Angeles.
A shared asset view helped teams coordinate across locations and understand which assets were shared. For customers who had no tracking solution, this provided visibility they previously lacked.
Customers cited the clean, easy-to-use interface as a reason for choosing Momentum over alternatives.
The founder had an MVP plan and a roadmap for the following year of hardware and software work.
Additional customers became design partners and participated in product testing.